GOES-R IFR Probability fields, hourly from 0215-1115 UTC on 2 August 2017 (Click to enlarge)
GOES-R IFR Probabilities are computed using Legacy GOES (GOES-13 and GOES-15) and Rapid Refresh model information; GOES-16 data will be incorporated into the IFR Probability algorithm in late 2017
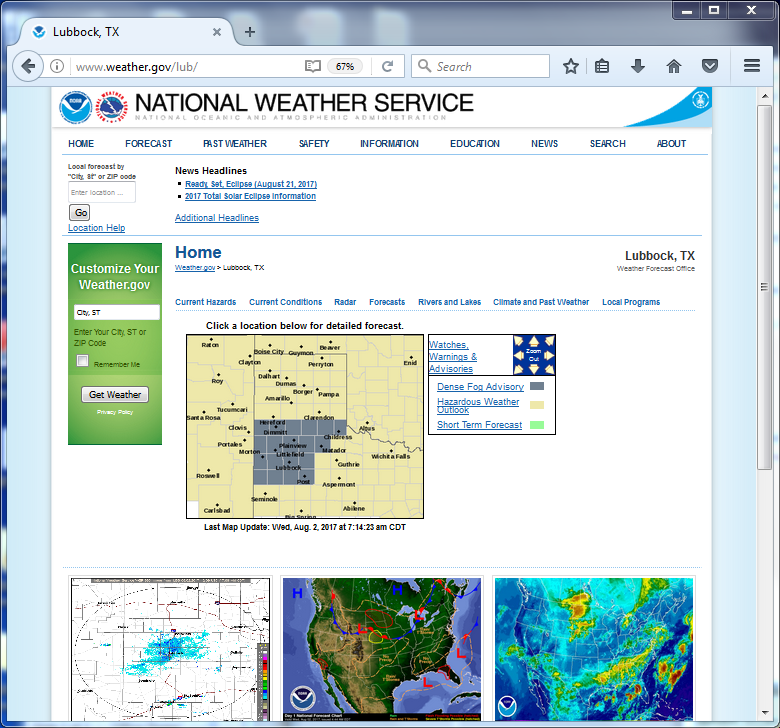
The National Weather Service in Lubbock issued Dense Fog Advisories (below) for parts of their CWA early in the morning on 2 August 2017. GOES-R IFR Probability fields, above, show a slow increase in values over west Texas during the night of 1-2 August 2017, as visibilities drop and ceilings lower in the region. This followed a band of showers that moved through the area around sunset on 1 August (Click here for a visible image from 0017 UTC on 2 August, from this site). Highest IFR Probability values at the end of the animation generally overlay the Dense Fog Advisory. As a situational awareness tool for the developing fog/low stratus, IFR Probability performed well.
GOES-16 data posted on this page are preliminary, non-operational and are undergoing testing
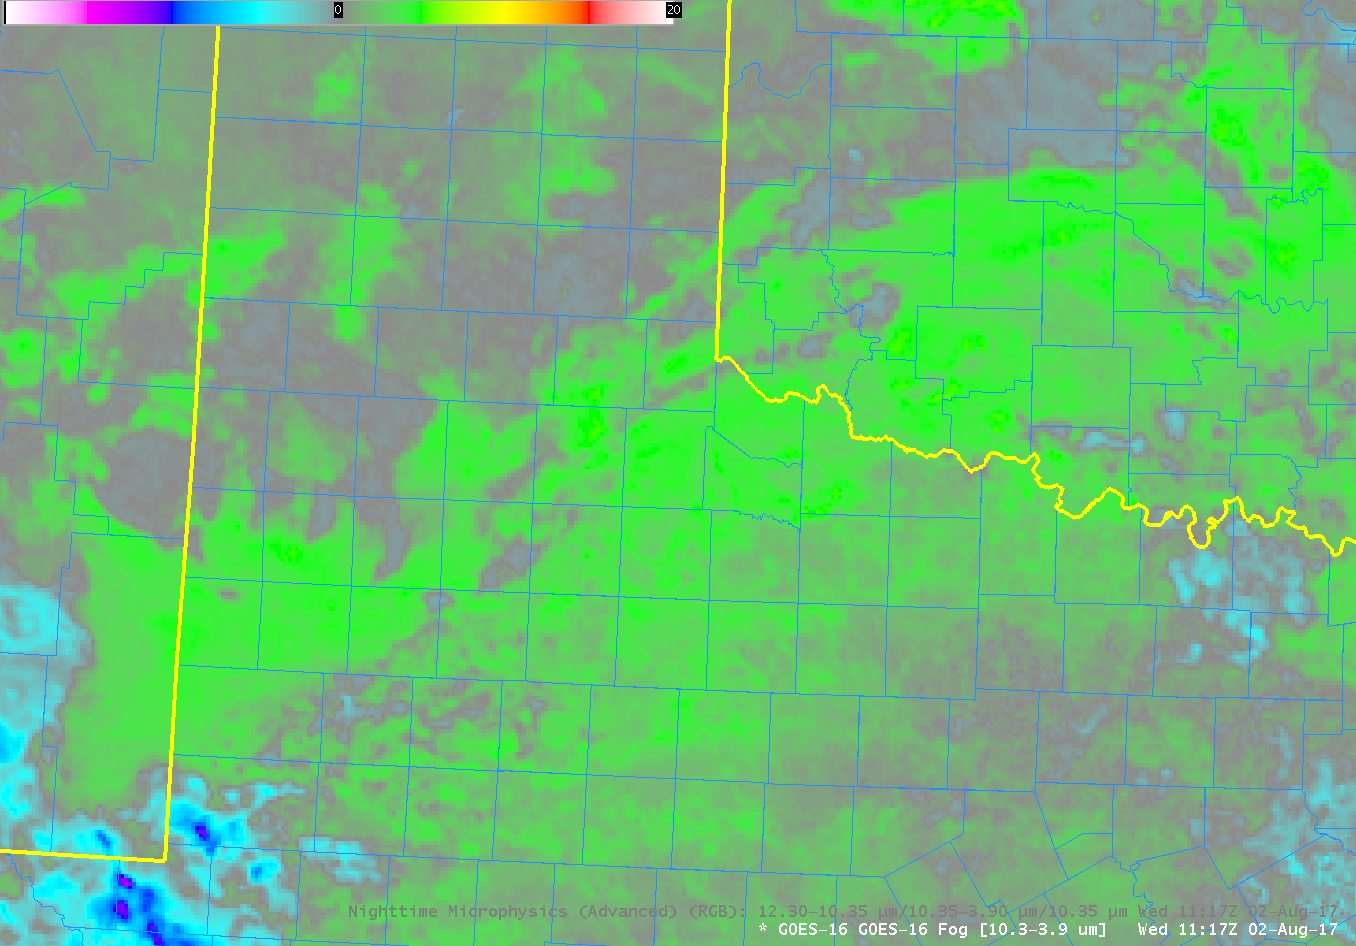
GOES-16 Brightness Temperature Difference field (10.3 µm – 3.9 µm) at 1117 UTC on 2 August 2017 (Click to enlarge)
The GOES-R IFR Probability fields above mostly show the small-scale variability (i.e., pixelation) that is common when both (legacy) GOES data and Rapid Refresh Data are used to produce a probability that IFR conditions will be present. Some exceptions: southeastern New Mexico at the end of animation (1115 UTC); the yellow and orange region there overlain by mid-level or high clouds that prevent a satellite view of the low clouds. The GOES-16 Brightness Temperature Difference (10.3 µm – 3.9 µm) field at 1117 UTC shows a signal of high clouds there (cyan / blue / purple enhancement showing negative values that typify thin cirrus in the Brightness Temperature Difference field at night). The Green values in the color enhancement are positive values and correspond to stratus (composed of water droplets) clouds. Because the Brightness Temperature Difference field shows a signal, the Advanced Nighttime Microphysics RGB will also have a signal for fog (the whitish/cyan color), as shown below.
GOES-16’s better temporal and spatial resolution allow for more accurate monitoring of the development of small-scale features. However, the shortcomings of using a Brightness Temperature Difference from satellite to monitor fog development should not be forgotten: In regions of cirrus, satellite views of low stratus and fog are blocked. In addition, over Texas and the rest of the High Plains, upslope flow can generate stratus over the central Plains that becomes fog over the High Plains as the terrain rises into the clouds. The top of the stratus cloud and the fog bank in such a case can look very similar from satellite.
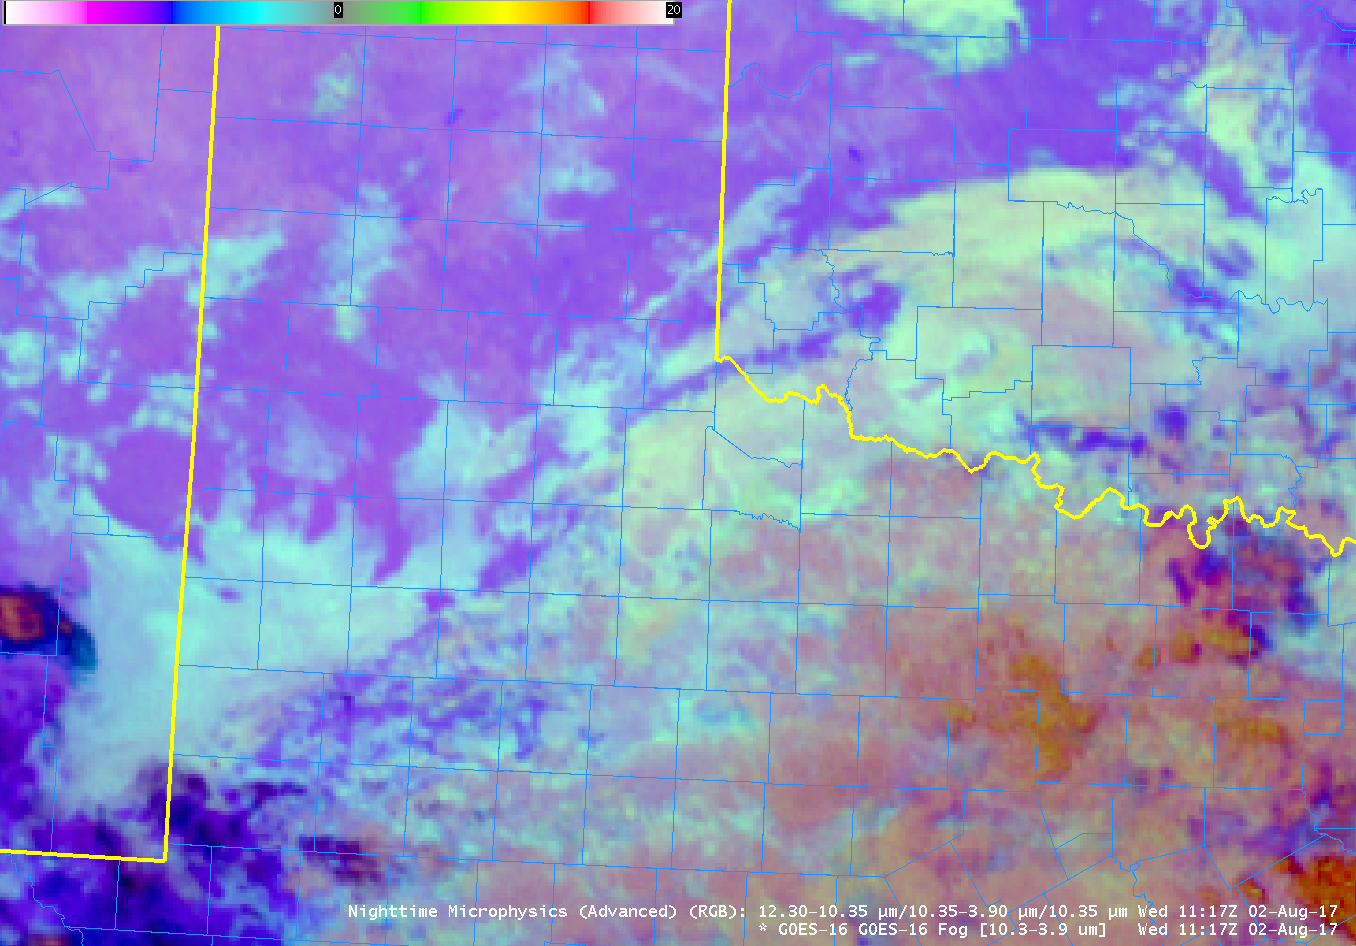
Advanced Microphysics RGB Composite at 1117 UTC on 2 August 2017 (Click to enlarge)
Below is a toggle between the 1115 UTC IFR Probability field, the GOES16 Brightness Temperature Difference Field, and the GOES16 Advanced Microphysics RGB Composite.
GOES-R IFR Probability fields computed with legacy GOES data and Rapid Refresh model output, GOES-16 Brightness Temperature Difference (10.3 µm – 3.9 µm) field and GOES-16 Advanced Microphysics RGB, all near 1115 UTC on 2 August 2017 (Click to enlarge)