Category Archives: Error Explanations

IFR Probabilities over snow

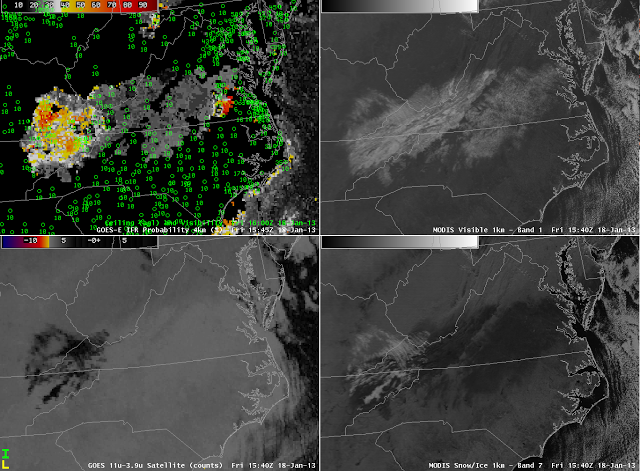
GOES-R IFR Probabilities from GOES-East and surface observations (Upper Left), MODIS visible imagery (Upper Left), MODIS Brightness Temperature Difference (10.7 µm- 3.9 µm) (Lower Left), MODIS Band 7 (2.2 µm )

GOES-R Cloud Type product from 1545 UTC 18 January 2013

GOES-R IFR Probabilities showed values around 20-25% over the fresh snow cover in south-central Virginia in the Piedmont.  Why?  The GOES-R cloud mask sometimes detects clouds where fresh snowfall is present, as shown in the GOES-R Cloud Type product above, especially if the snow mask is not up to date. The GOES-R cloud type product determines the phase of any pixel detected as cloud by the cloud mask;  clouds were detected, albeit incorrectly, in this area and classified as water clouds. It is unlikely that clouds are present over south-central Virginia because the brightness temperature difference product suggests no water-based clouds in this region — the white areas in the visible over southern Virginia and northern North Carolina have a signature in the 2.2 µm channel (lower right in the 4-panel image) that is strongly indicative of snow on the ground (snow strongly absorbs radiation at that wavelength, so little energy is reflected back to the satellite). The GOES-R FLS product is dependent upon the GOES-R cloud mask during the day and calculates the probability that IFR conditions are present for any detected cloudy pixel.  The presence of clouds in the Cloud Type product for reasons stated above leads to the calculation of an IFR probability where clear sky is likely present.  Although the IFR probabilities are higher over the fresh snow than in other clear sky areas, the probabilities are relatively low, around 20-25%. Probabilities in this range should give forecasters low confidence that IFR conditions are present in this area. Conversely, the small region of relatively high IFR probabilities (>50%) in southwest Virginia — near Wakefield — and extreme southwest Virginia — near Wise — correlates well with a region of eroding IFR conditions. Note that cloud ceilings over the mountains of far western Virginia are very close to or below IFR criteria, giving forecasters higher confidence that IFR conditions are present.

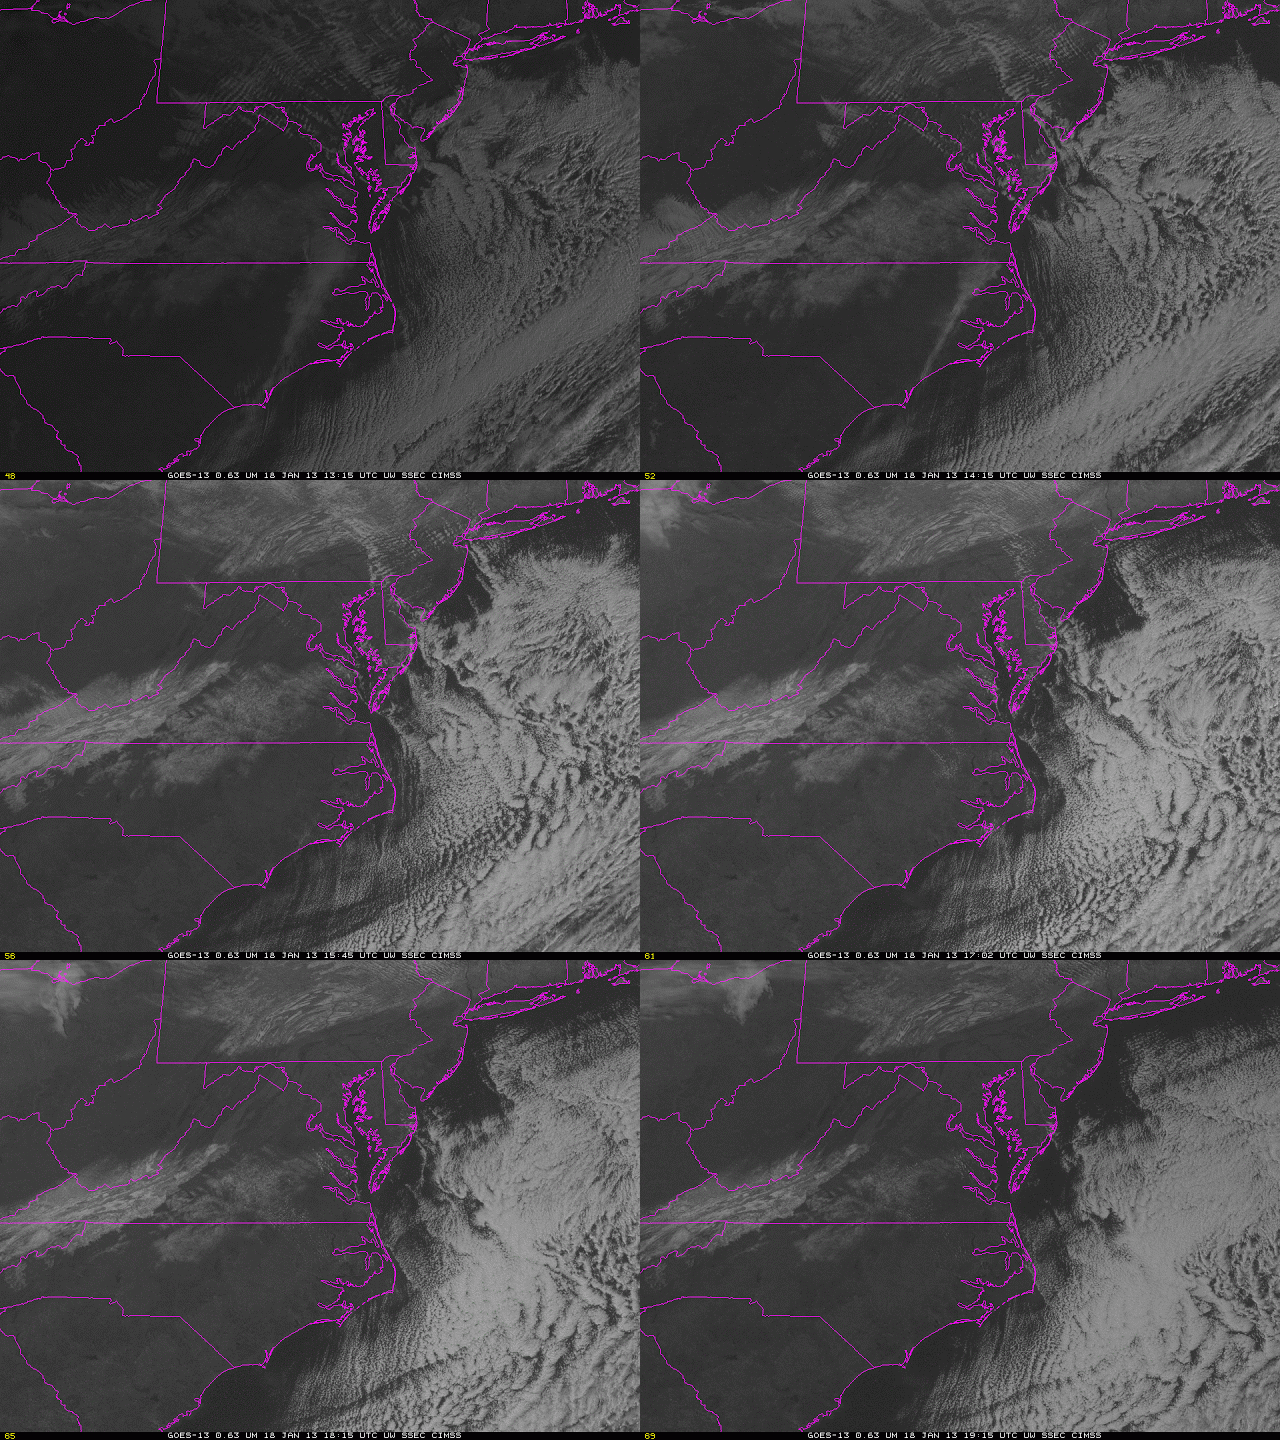
GOES-13 Visible Imagery over the mid-Atlantic showing snow cover over Virginia

The Visible imagery above shows generally clear skies over central Virginia, with some cloud streets developing later in the afternoon. The eroding IFR cloud deck over extreme SW Virginia is difficult to see in visible imagery alone but is evident by the dissipating clouds in western Kentucky.

Dense Fog over the Upper Midwest

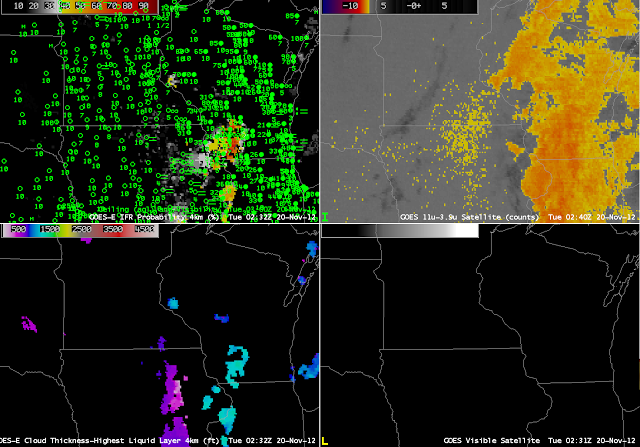
GOES-R IFR Probabilities computed from GOES-East (upper left), GOES-East Traditional Brightness temperature difference, 10.7 µm  – 3.9 µm (upper right), GOES-R Cloud Thickness (lower left), GOES-East Visible (0.63 µm ) imagery (lower right), from approximately 0230 UTC 20 Nov 2012.

Dense fog developed over portions of the upper Mississippi Valley early in the morning on 20 November 2012.  This event forced delayed openings for many eastern Iowa schools.  How well did the GOES-R Fused Data products do for this event?  The animation above shows the quick development of high IFR probabilities over Iowa;  development over northwest Wisconsin, where IFR conditions were observed, was delayed.  Why?  The imagery above, from 0230 UTC, shows IFR probabilities increasing over eastern Iowa where near IFR conditions are already developing.  At 0330 UTC, below, ceilings and visibilities continue to lower over eastern Iowa where IFR Probabilities increase.  Note that the traditional brightness temperature difference field shows a strong signal over Wisconsin and Illinois — but IFR conditions there are not widespread, and IFR probabilities are except over southwest Wisconsin.  The 0330 imagery also hints at higher clouds moving in from the west over southwest Minnesota and western Iowa/eastern Nebraska, where the darker regions in the brightness temperature difference product exists.
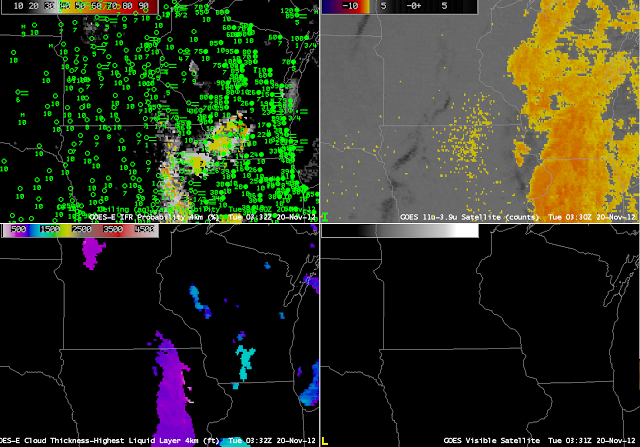
GOES-R IFR Probabilities computed from GOES-East (upper left), GOES-East Traditional Brightness temperature difference, 10.7 µm  – 3.9 µm (upper right), GOES-R Cloud Thickness (lower left), GOES-East Visible (0.63 µm ) imagery (lower right), from approximately 0330 UTC 20 Nov 2012.
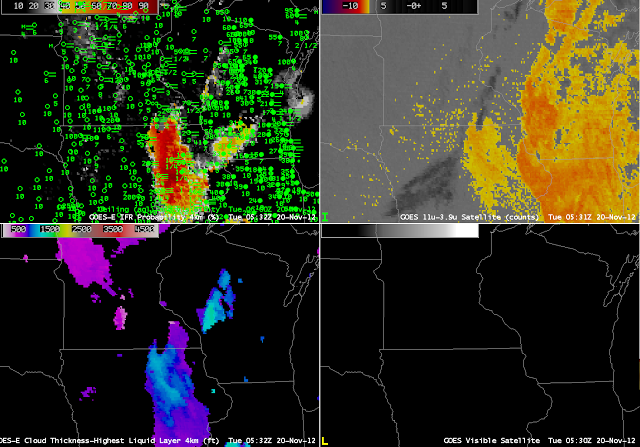
GOES-R IFR Probabilities computed from GOES-East (upper left), GOES-East Traditional Brightness temperature difference, 10.7 µm  – 3.9 µm (upper right), GOES-R Cloud Thickness (lower left), GOES-East Visible (0.63 µm ) imagery (lower right), from approximately 0530 UTC 20 Nov 2012.

Two hours later, at 0530 UTC, IFR conditions are widespread over eastern Iowa where the traditional brightness temperature difference product has a signal, and where GOES-East-based GOES-R IFR Probabilities are very high.  The Traditional brightness temperature difference signal from GOES-East continues to have a strong signal over central Wisconsin southward into Illinois where, except for southwest Wisconsin, IFR conditions are not common.  Note the development of IFR conditions in northwest Wisconsin, in a region where IFR probabilities are low.  In this region, satellite detection of low clouds is complicated by higher clouds (indicated by the dark region in the brightness temperature difference product).  In addition, low-level relative humidity fields at this time in the Rapid Refresh model are lower than they are over Iowa (see the animation of fields used to compute IFR probabilities at the bottom of this post).
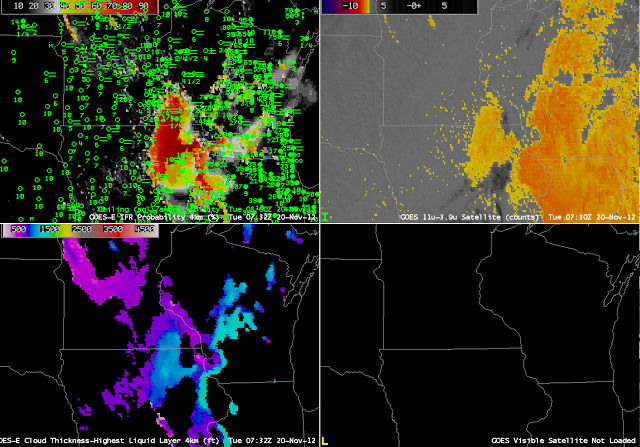
GOES-R IFR Probabilities computed from GOES-East (upper left), GOES-East Traditional Brightness temperature difference, 10.7 µm  – 3.9 µm (upper right), GOES-R Cloud Thickness (lower left), GOES-East Visible (0.63 µm ) imagery (lower right), from approximately 0730 UTC 20 Nov 2012.

At 0730 UTC, above, mid-level clouds over eastern Iowa are having an effect on IFR probabilities there.  Because satellite predictors cannot give a strong indication of fog/low stratus when mid-level (or higher) clouds are present, IFR probabilities will decrease.  This is happening over portions of eastern Iowa where IFR conditions persist.  Probabilities fall, and the field acquires a much smoother look;  in addition, Cloud thickness is not computed.  These occurrences all are a consequence of the presence of higher clouds, as depicted by the darker grey enhancement in the traditional brightness temperature difference field.  Note that IFR probabilities continue to be fairly low over northwest Wisconsin where IFR or near-IFR conditions are present.
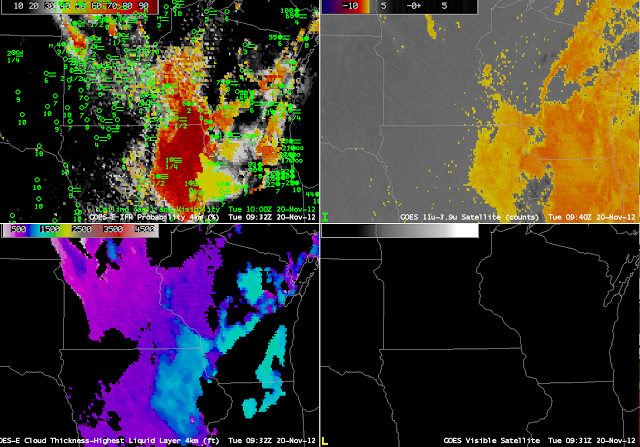
GOES-R IFR Probabilities computed from GOES-East (upper left), GOES-East Traditional Brightness temperature difference, 10.7 µm  – 3.9 µm (upper right), GOES-R Cloud Thickness (lower left), GOES-East Visible (0.63 µm ) imagery (lower right), from approximately 0930 UTC 20 Nov 2012.

By 0930 UTC, IFR probabilities finally do increase over northwest Wisconsin where IFR or near-IFR conditions are present (similarly, they increase over eastern Wisconsin near Lake Michigan).  Both the satellite signal and the Rapid Refresh signal have started to suggest low clouds near the surface, as observed.  An animation of fields important to the computation of IFR probabilities is below.  Note how the near-surface relative humidity saturates first over eastern Iowa;  that saturation is slow to spread northward into northwest Wisconsin.
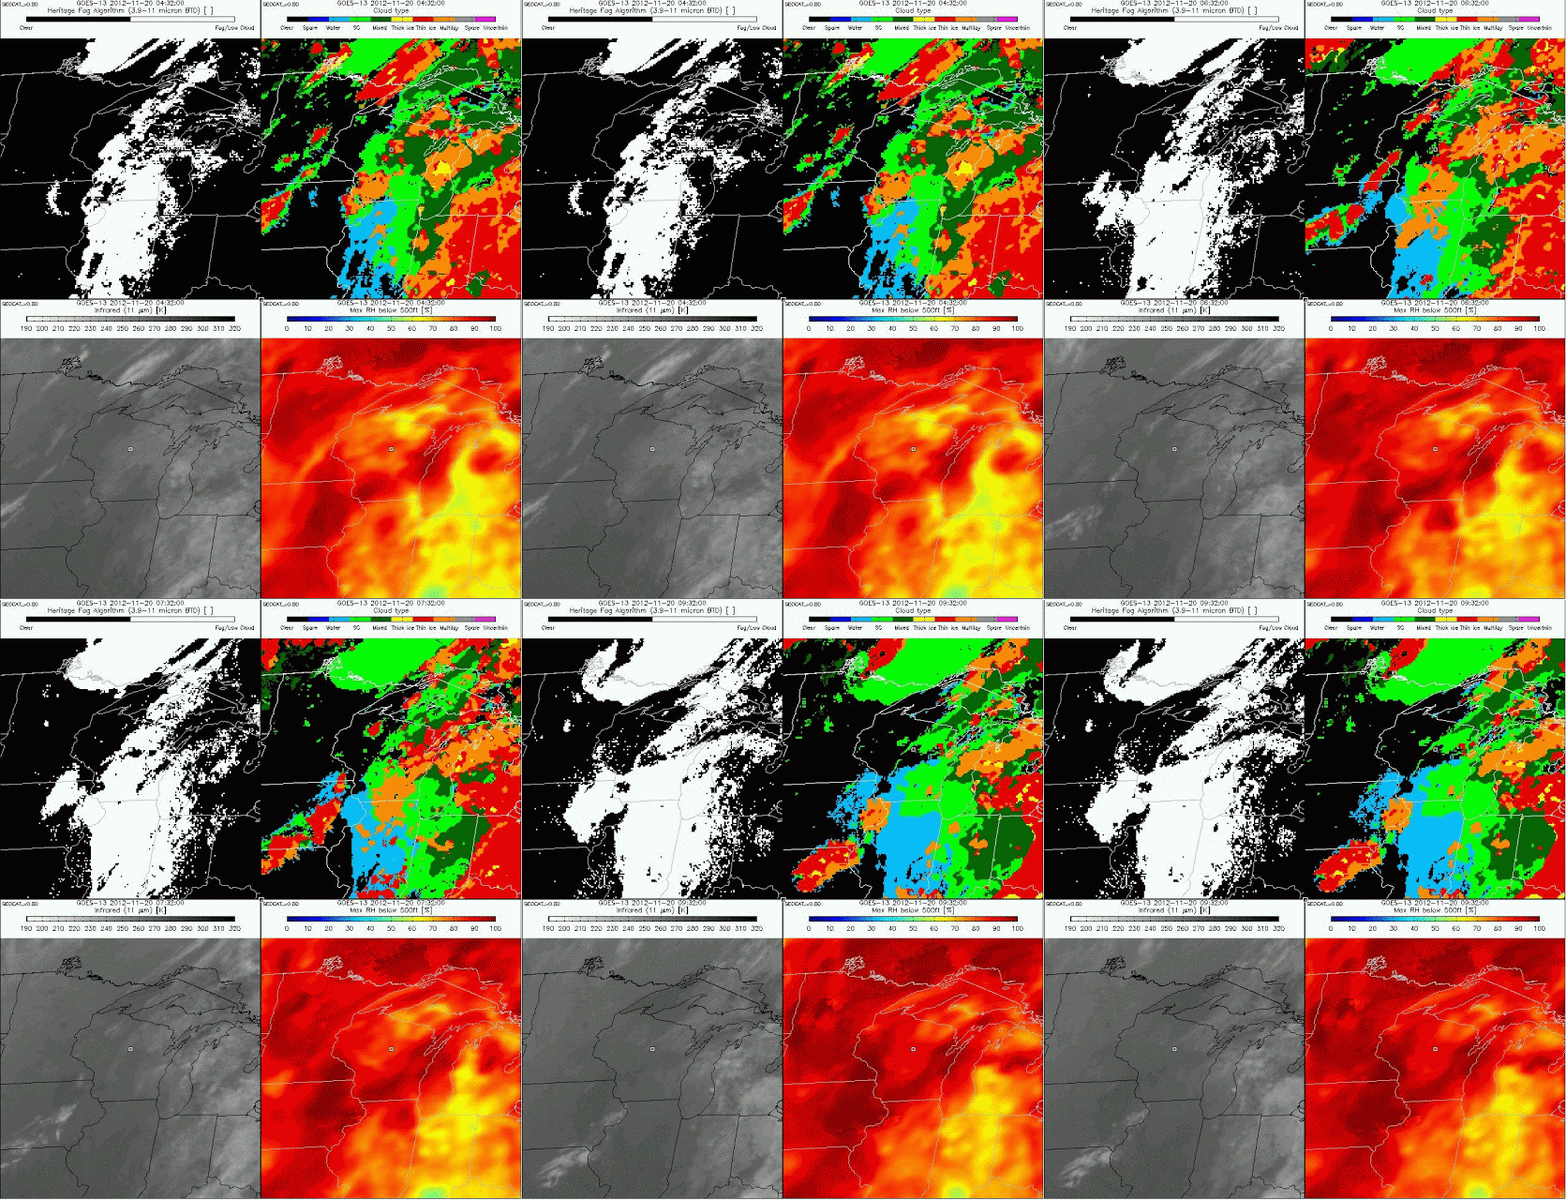
Heritage Fog Algorithm (10.7 µm – 3.9 µm ) from GOES-East (upper left, white = fog/low stratus), GOES-R Cloud Type (upper right), GOES-East 10.7 µm imagery (lower left), Peak Rapid Refresh Model Relative Humidity below 500 m (lower right), hourly from 0432 UTC through 0932 UTC, 20 November 2012.  Data from this site.

The last pre-twilight Cloud Thickness product can be used to guess the dissipation of radiation fog.  Those data are shown below.  Cloud thickness over eastern Iowa and southwest Wisconsin peaks around 1200 feet.  This graph suggests, then, a dissipation time about 5 hours after sunrise.
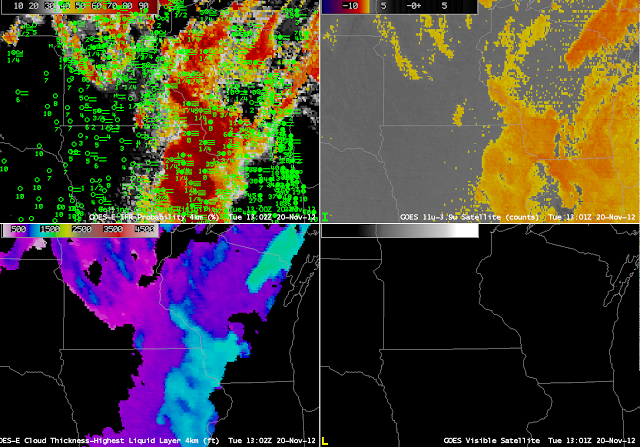
GOES-R IFR Probabilities computed from GOES-East (upper left), GOES-East Traditional Brightness temperature difference, 10.7 µm  – 3.9 µm (upper right), GOES-R Cloud Thickness (lower left), GOES-East Visible (0.63 µm ) imagery (lower right), from approximately 1300 UTC 20 Nov 2012.
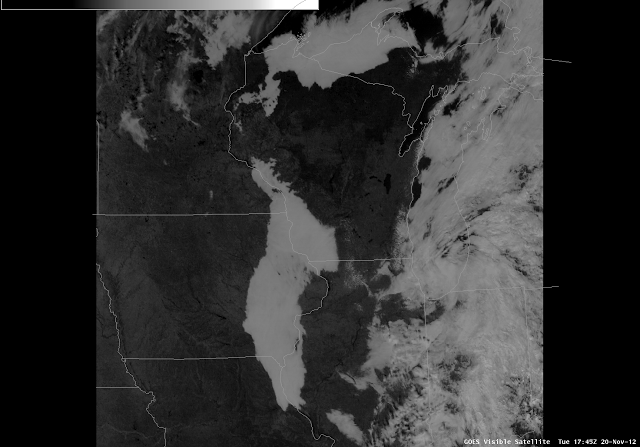
GOES-East Visible Imagery, 1745 UTC

Note how well the low clouds over eastern Iowa at 1745 UTC align with the cloud thickness field at 1300 UTC!
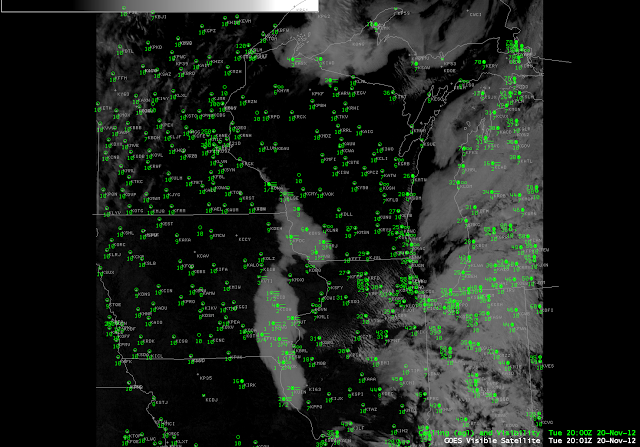
GOES-East visible imagery and station ceilings/visibilities, 2002 UTC

(Update:  The low sun angle of mid- to late-November is making it difficult for the fog to burn off.  As of 2000 UTC, stratus persists)
GOES-R Fog Products vs. ‘Traditional’ Products over Florida

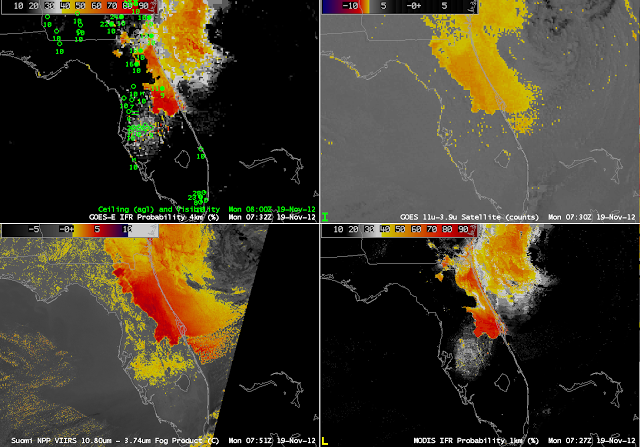
GOES-R IFR Probabilities computed from GOES-East (Upper left), Traditional Brightness Temperature Difference (10.7 µm – 3.9 µm) (Upper right), Brightness Temperature Difference (10.8 µm – 3.74 µm) from Suomi/NPP data (Lower Left), GOES-R IFR Probabilities computed using MODIS data (Lower Right)

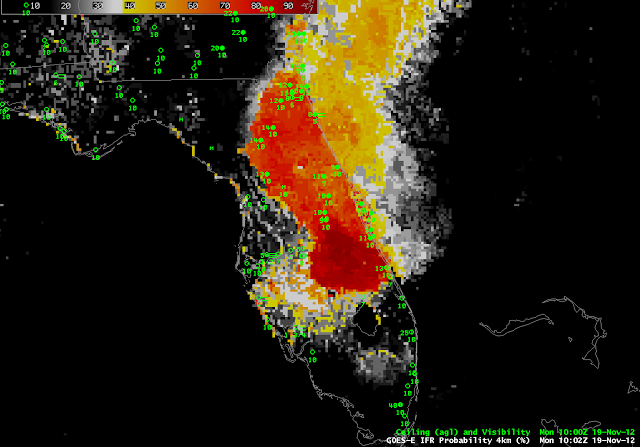
Fog and low clouds that developed over central Florida (again) on Monday morning, 19 November, highlight some strengths and shortcomings of the different fog detection techniques.  The GOES-R IFR Probability (upper right) shows highest probabilities in the region where the traditional brightness temperature difference product has a distinct signal.  But there is also a region of IFR probabilities (albeit low) east of Tampa Bay where the traditional brightness temperature difference product has no distinct signal.  This is likely a region of developing fog/low stratus.  Note that the higher-resolution Brightness Temperature Difference product from VIIRS on Suomi/NPP has a signal in that region, and the MODIS-based IFR Probability (lower right) field is also consistent with a developing fog/low stratus field.  The low IFR Probabilities in the GOES-based signal should alert to the possibility of developing fog.  Note that both the GOES-Based and MODIS-based IFR probabilities show a narrower strip of fog/low stratus south of Jacksonville than is represented in the GOES and Suomi/NPP Brightness Temperature Difference fields.  In this region, the Rapid Refresh Model data are refining the satellite predictors to represent more accurately the distribution of fog/low stratus in the Rapid Refresh model output.   The IFR Probabilities at 1000 UTC (below) shows that IFR conditions did indeed develop in that region of interior Florida to the east of Tampa.

GOES-R IFR Probabilities at 1002 UTC, computed from GOES-East and the Rapid Refresh Model

The Traditional Brightness Temperature Difference field shows a signal that parallels the west-facing Gulf coasts of Florida.  This signal arises from a co-registration error between the shortwave IR and longwave IR sensors on GOES (See this post for more examples).  This co-registration error is diurnally varying and typically peaks between midnight and sunrise.

Stray Light in the GOES-R IFR Fog Product

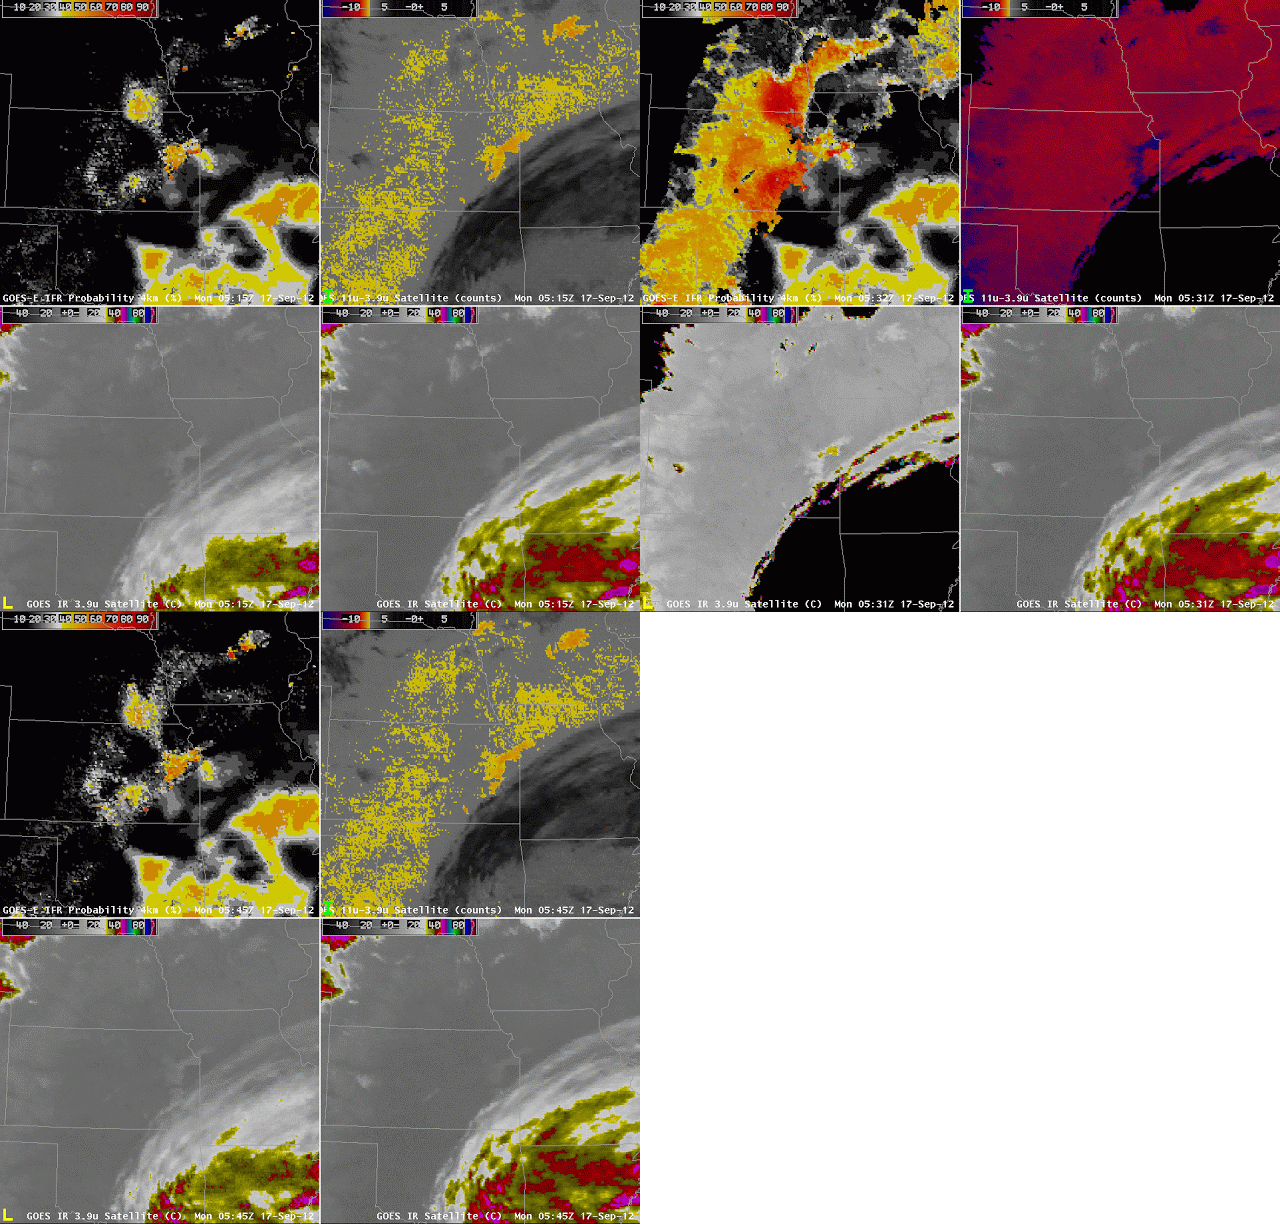
GOES-R IFR Probabilities (upper left), 10.7 µm – 3.9 µm brightness temperature differences (upper right), 3.9 µm micron brightness temperature (lower left), 10.7 µm micron brightness temperature (lower right)

Stray light occasionally intrudes into the 3.9 µm channel, and that has a big impact on both the brightness temperature difference and therefore on the GOES-R IFR product.  The stray light impact on the 3.9 µm channel is evident at 0531UTC — it does not impact the 10.7 µm channel.  The big impact on the brightness temperature difference translates to a big signal in the GOES-R IFR probabilities.  Note how GOES-R IFR probabilities do not change underneath the high-level cirrus over eastern OK, southern MO and Arkansas:  GOES-R IFR probabilities do not use satellite data in regions of multiple cloud layers, or in regions of ice clouds.

Emissivity properties in a drought

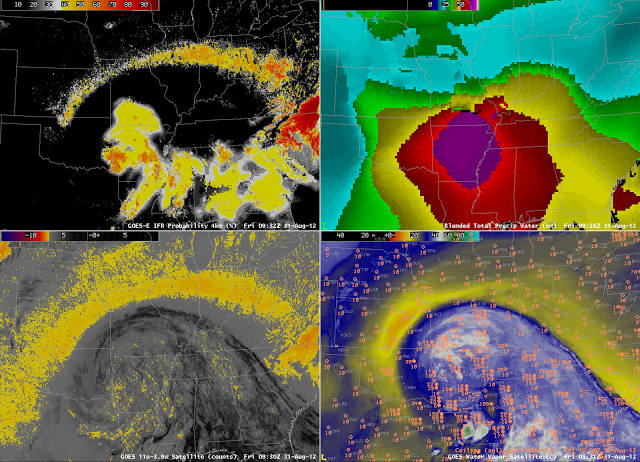
GOES-R IFR Probabilities (upper left), Total Precipitable Water (the so-called ‘Blended Product’) (upper right), 10.7 µm – 3.9 µm Brightness Temperature Difference (lower left), Enhanced Water vapor imagery with surface observations (lower right)

The driving mechanism in the brightness temperature difference product, the heritage method for detecting fog and stratus from satellites, keys on differences in the emissivity of water clouds at 3.9 µm versus the emissivity at 10.7 µm.  Water clouds do not emit 3.9 µm radiation as a blackbody does, but they do emit 10.7 µm radiation almost as a blackbody.

As ground dries out in a drought, its emissivity changes. Those changes are a function of wavelength.  This example is from early morning on 31 August, as the remnants of Isaac slowly spread northward.  The brightness temperature difference shows a strong signal around the cirrus canopy of the storm.  These highlighted regions arcing from Kansas to Illinois have suffered extreme drought all summer.  The satellite signal is so strong in this case over the very dry Earth — because of the changed emissivity properties of the parched Earth — that it cannot be overcome by the model parameters that are used.  As a result, IFR probabilities are high over Indiana and Illinois where no IFR conditions are observed.

Resolution and River Valleys

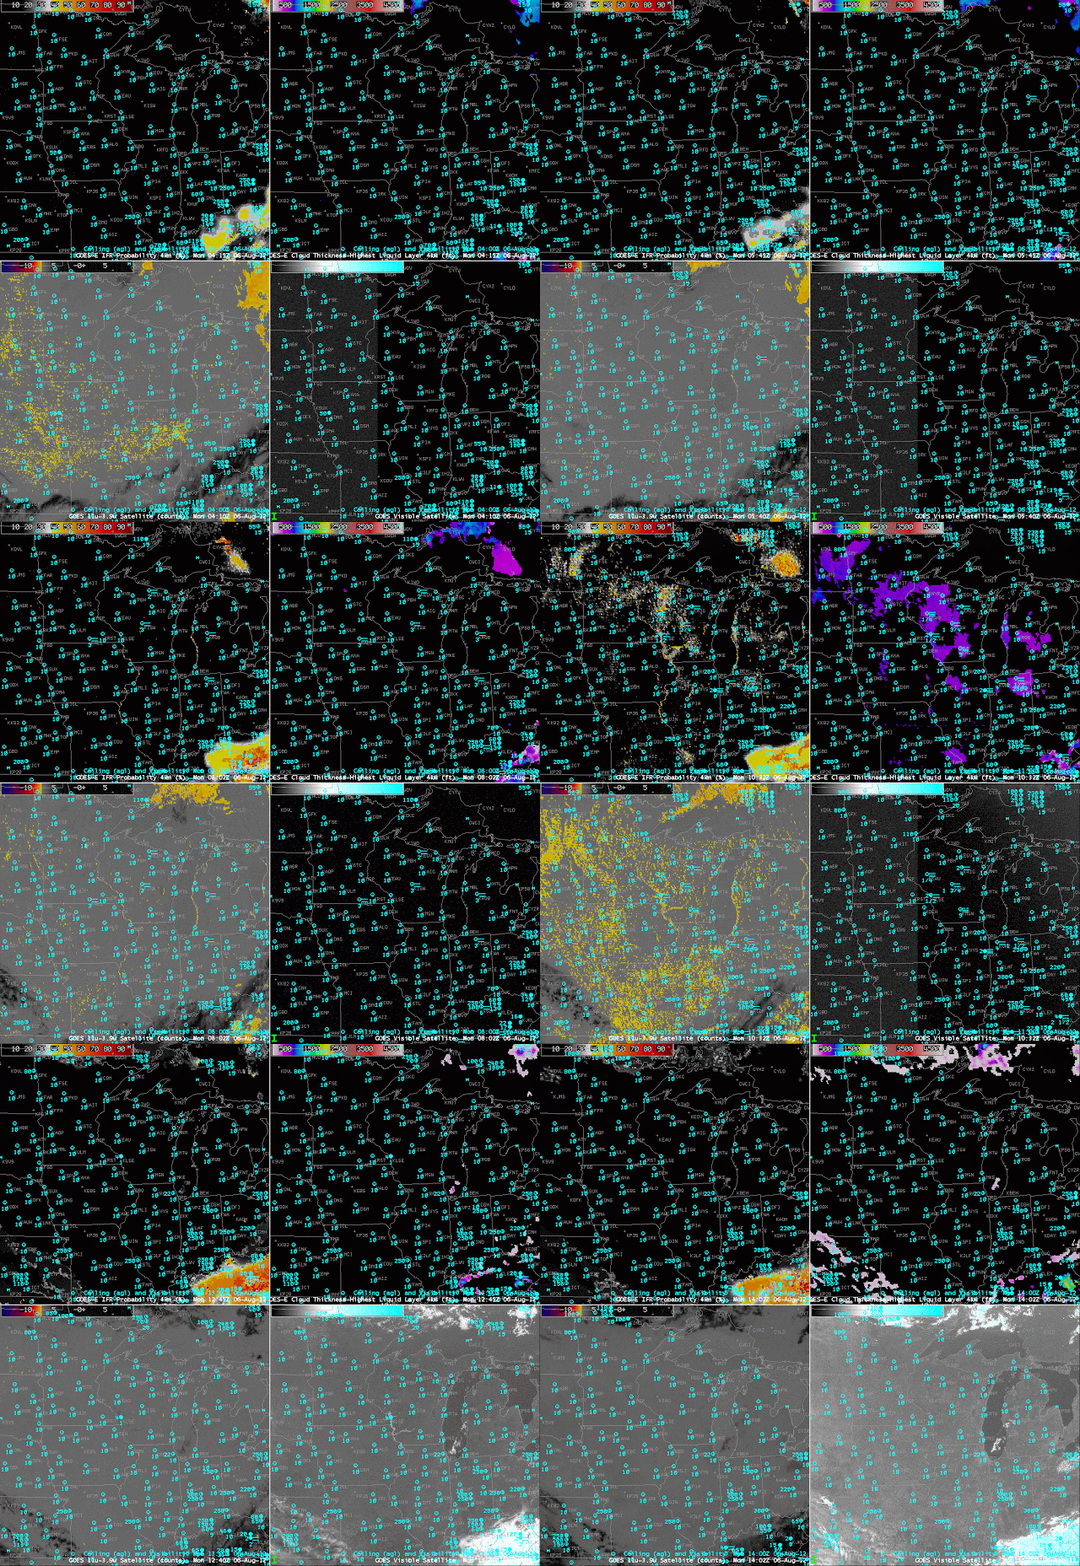
Animation of GOES-R IFR probabilities (upper left), GOES-R Cloud Thickness (upper right), GOES-East Brightness Temperature Differences (lower left), and Visible Imagery (lower right), from 0400 through 1400 UTC on 6 August 2012

River Valleys — sources of moisture — are nearly sub-pixel scale in GOES-East imagery.  Thus, any signal that develops in a river valley will likely take time to appear, and an example of that occurred over the upper Midwest on the morning of August 6th.  The signal develops along the river starting around 0800 — 0900 UTC (LaCrosse, WI, starts to report visibility and ceiling obstructions at 1000 UTC).  There are several interesting aspects in the loop.

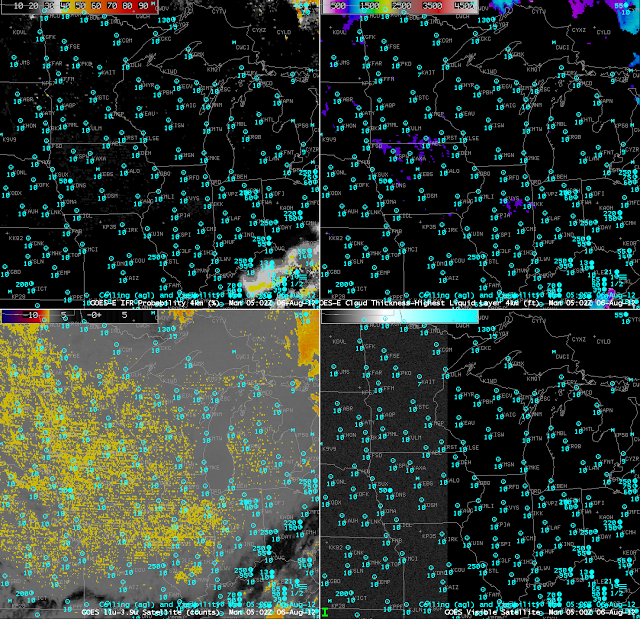
GOES-R IFR probabilities (upper left), GOES-R Cloud Thickness (upper right), GOES-East Brightness Temperature Differences (lower left), and Visible Imagery (lower right), at 0502 UTC on 6 August 2012

The imagery at 0502 UTC (above) shows the result of stray light contamination on the brightness temperature difference field (lower left), but this increase in signal over the Plains is ephemeral, and it is gone in 15 minutes.  There is also an increase in the brightness temperature difference signal over the Plains as sunrise approaches.

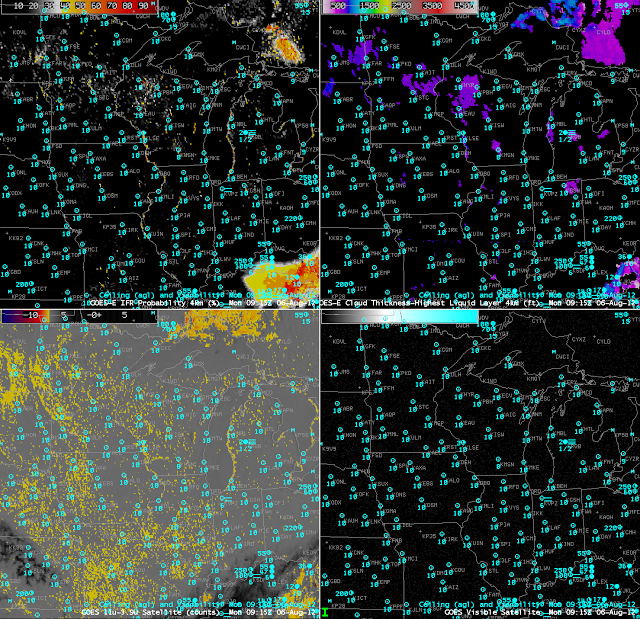
GOES-R IFR probabilities (upper left), GOES-R Cloud Thickness (upper right), GOES-East Brightness Temperature Differences (lower left), and Visible Imagery (lower right), at 0915 UTC on 6 August 2012

By 0915 UTC, the GOES-R IFR probabilities have increased slightly along the Wisconsin River in southwest Wisconsin, as has the brightness temperature difference signal (although that signal has increased elsewhere as well where the GOES-R IFR probabilities remain low).  Compare the (relatively) low-resolution GOES-based imagery to the higher resolution Suomi/NPP resolution discussed here.  Note also how the GOES-R IFR probability product correctly suppresses the IFR probabilities over Iowa and Missouri where observations show no obstructions to visibility.

Radiation Fog over Wisconsin

GOES-East visible imagery over Wisconsin, 1232 UTC 1 August 2012

Fog developed over southern Wisconsin overnight on 1 August under clear skies and light winds.  The Wisconsin River, the Mississippi River and the Kickapoo River are starkly outlined by the fog that formed.  How well did the GOES-R IFR products do in diagnosing this event?

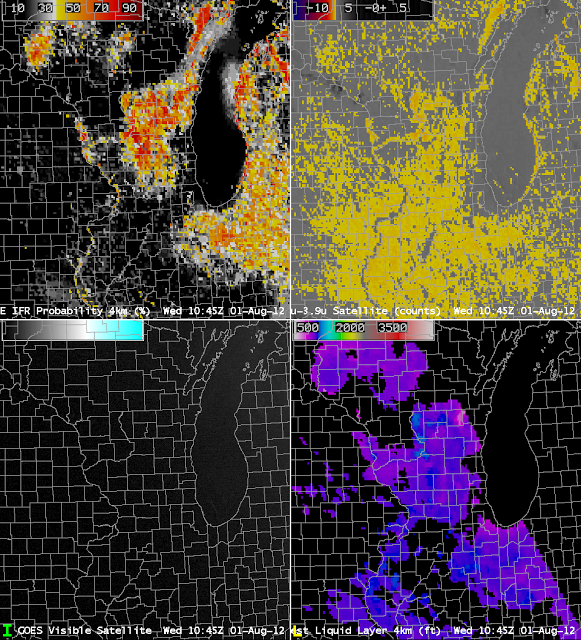
GOES-R IFR Probabilities (Upper Left), Traditional Brightness Temperature Difference Fog Product (upper right), Visible Imagery (lower left), GOES-R Cloud Thickness (lower right), all from 1045 UTC on 1 August 2012

Note that the IFR Probabilities (above, upper left) are highest over south-central Wisconsin.  In addition, a ribbon of higher values snakes down the Wisconsin River, and down the Mississippi River, in accordance with observations at 1232 UTC.  In contrast, the brightness temperature difference field shows returns suggestive of fog over most of Illinois and eastern Iowa, where fog was not observed just after sunrise.  The curious lack of fog signal over the Mississippi and Illinois Rivers likely arises from the co-registration error (discussed here) that also causes the spike in brightness temperature difference signal along the southeastern shore of Lake Michigan.

The thickest clouds are diagnosed at 1045 UTC (the last such image made before twilight conditions make the product unreliable) show the thickest clouds over central Wisconsin.  The 1415 UTC visible image, below, shows the region where fog/low clouds have lingered longest:  over central Wisconsin.

Visible Imagery from GOES-13, 1415 UTC on 1 August 2012

Again, GOES-R IFR Probabilities accurately outlined the region where fog was present (and equally importantly, where it was not).  The thickest clouds were the last to erode.  The relationship between fog thickness and dissipation time is given here.

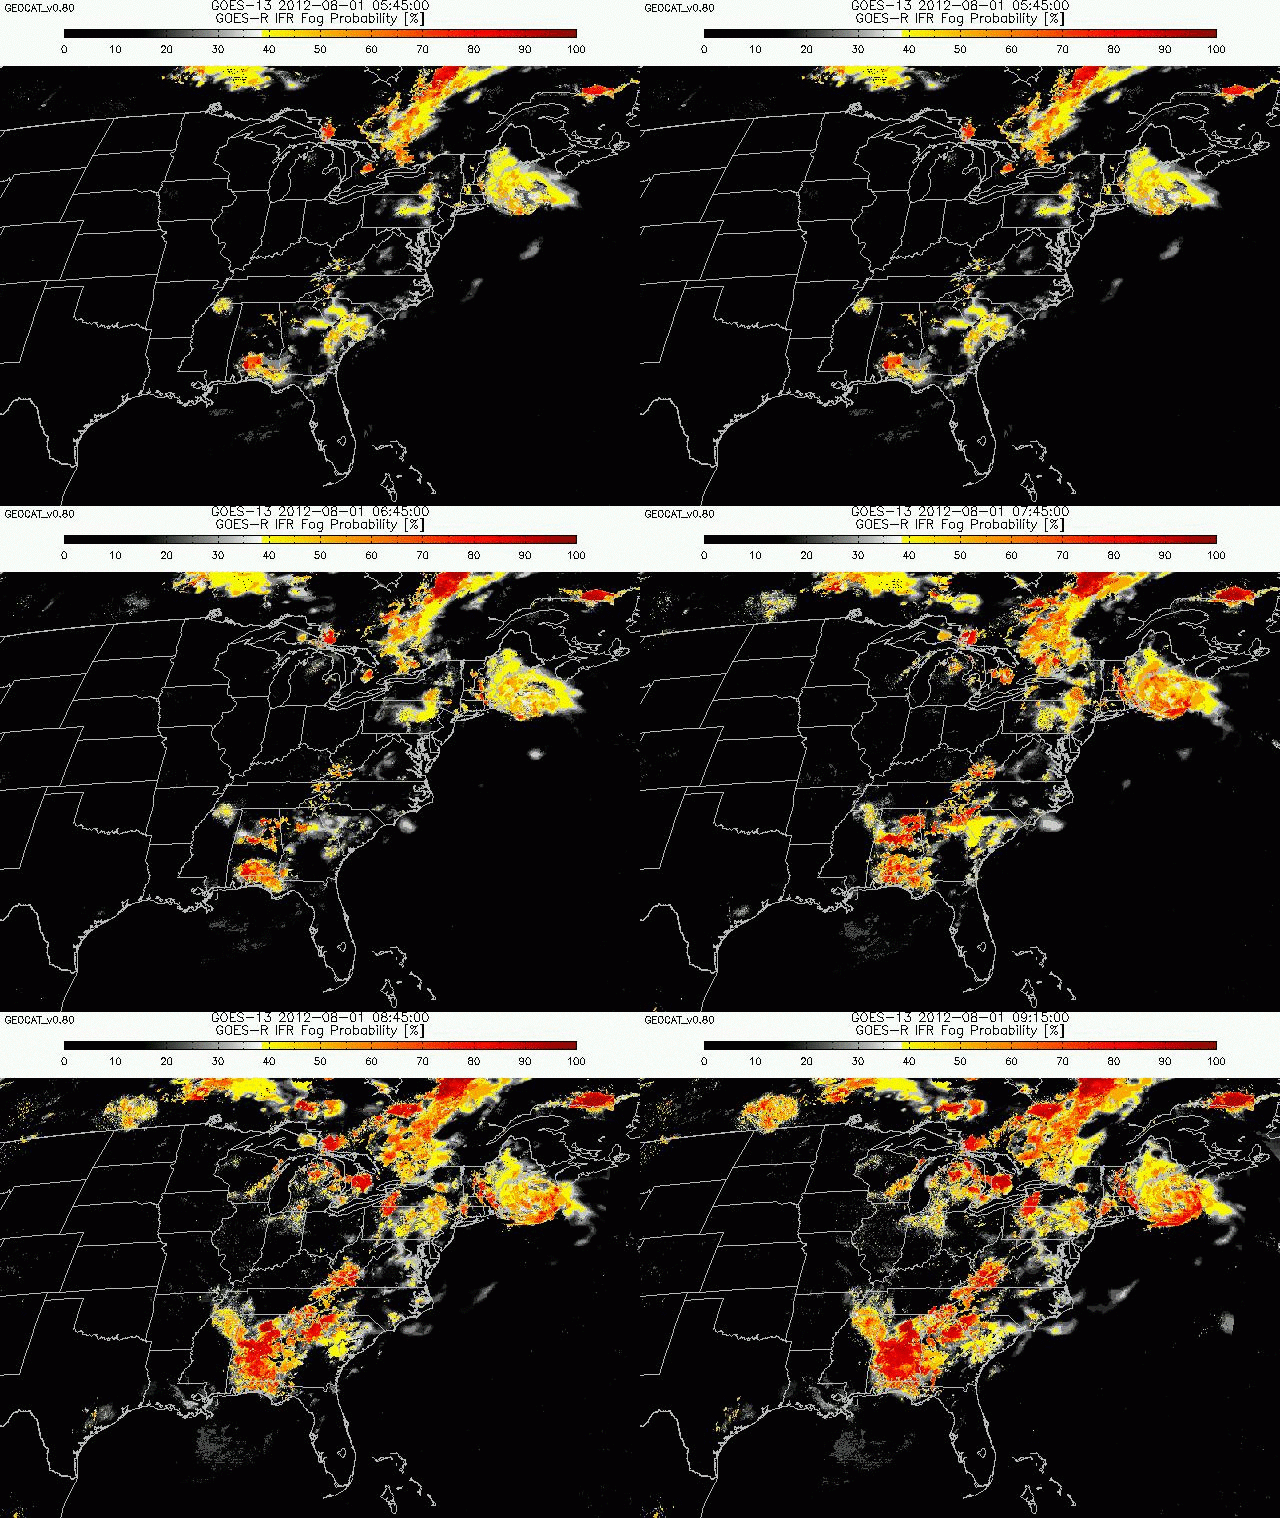
Data from the GEOCAT browser at CIMSS shows how the GOES-R IFR Probabilities field evolved with time in the early morning hours of the 1st (below)

GOES-R Probabilities are too low: Why?

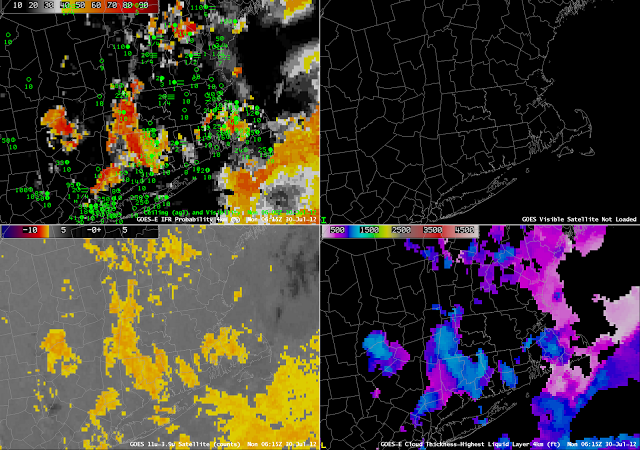
GOES-R IFR Probabilities (upper left), GOES-East Visible imagery (upper right), Brightness temperature difference between 10.7 and 3.9 micrometers (lower left), GOES-R Cloud Thickness (lower right)

The imagery above shows high IFR probabilities over western Massachusetts — where IFR conditions are not observed — and very low probabilities in central Massachusetts in and near the Connecticut River Valley where IFR conditions are observed.  The brightness temperature difference in central Massachusetts is not suggestive of low clouds and fog.  For the IFR probability to be high there, then, would require that the Rapid Refresh Model showed saturation in the lower part of the model atmosphere.  Thus, the fused product could show higher probabilities in this region where fog is observed.  However, as shown below, relative humidity in the lowest part of the model was actually a relative minimum over central Massachusetts.

Two-hour forecasts of Relative Humidity from the Rapid Refresh, all valid at 0600 UTC from the 0400 UTC model run;  Lowest 30 mb of the model (upper left), lowest 60 mb of the model (upper right), lower 90 mb of the model (lower left), surface (lower right)
Two-hour forecasts of Relative Humidity from the Rapid Refresh, all valid at 0800 UTC from the 0600 UTC model run;  Lowest 30 mb of the model (upper left), lowest 60 mb of the model (upper right), lower 90 mb of the model (lower left), surface (lower right)

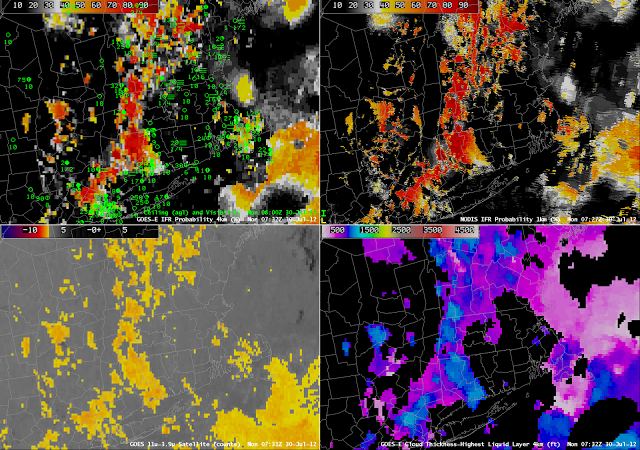
By 0730 UTC, the satellite brightness temperature difference product (below) is starting to suggest that fog/low clouds are more widespread (A MODIS image at the same time tells the same tale).  As that happens, the IFR probabilities start to increase.

GOES-R IFR Probabilities computed from GOES-East imager data (upper left), GOES-R IFR probabilities computed from MODIS data (upper right), Brightness temperature difference between 10.7 and 3.9 micrometers (lower left), GOES-R Cloud Thickness (lower right)
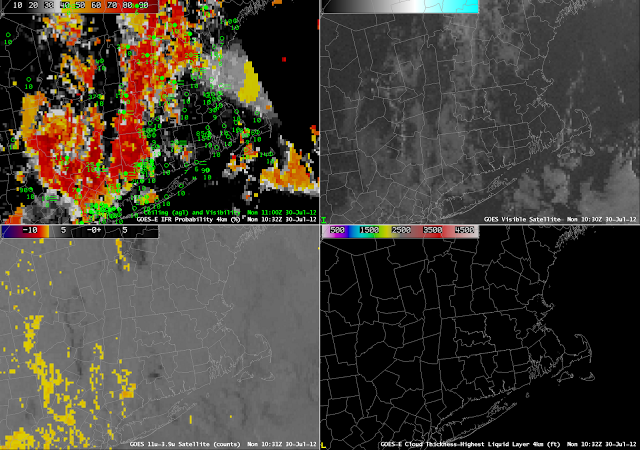
GOES-R IFR Probabilities (upper left), GOES-East Visible imagery (upper right), Brightness temperature difference between 10.7 and 3.9 micrometers (lower left) at 1032 UTC, GOES-R Cloud Thickness (lower right) not shown because of twilight conditions

The 1032 UTC imagery (above) shows the very small scale of this fog feature that is in central Massachusetts.

The Terminator

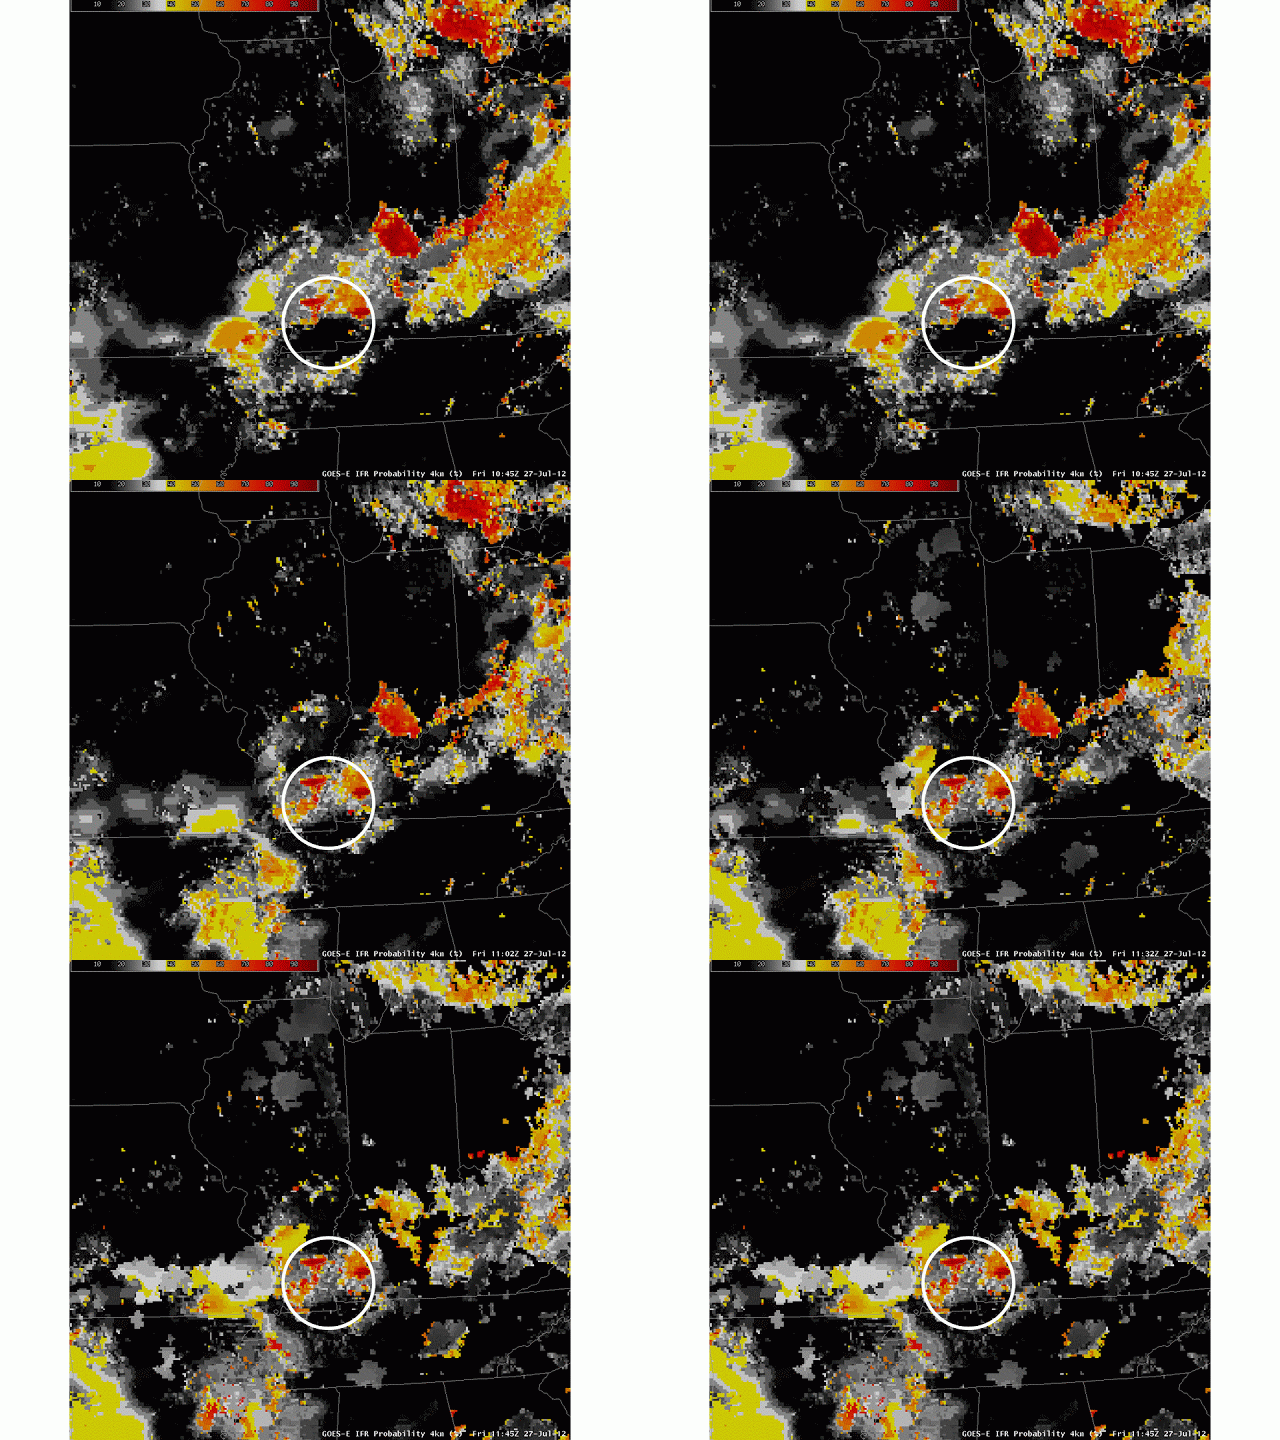
GOES-R IFR Probabilities near sunrise on 27 July 2012

The loop above demonstrates an artifact of the GOES-R IFR probabilities that occurs due to the terminator.  Note how values within the circled region are constant for the last three images.   When the solar zenith angle is between 85-90 degrees there is a stabilizing temporal aspect to the algorithm. In these 5 degrees (just after sunrise), the last nighttime satellite parameters from an angle >90 degrees are kept and used (and re-used) because the visible channels are not reliable at such high solar zenith angles. Current Rapid Refresh model information is used, but if the model data doesn’t vary greatly over this timeframe then it is likely that the same information will be used for the Bayesian model, thus resulting in the same probability values. This approach reduces significant artifacts in the terminator region where FLS detection is complicated by a low sun angle and the attendant rapid changes in reflectivity.

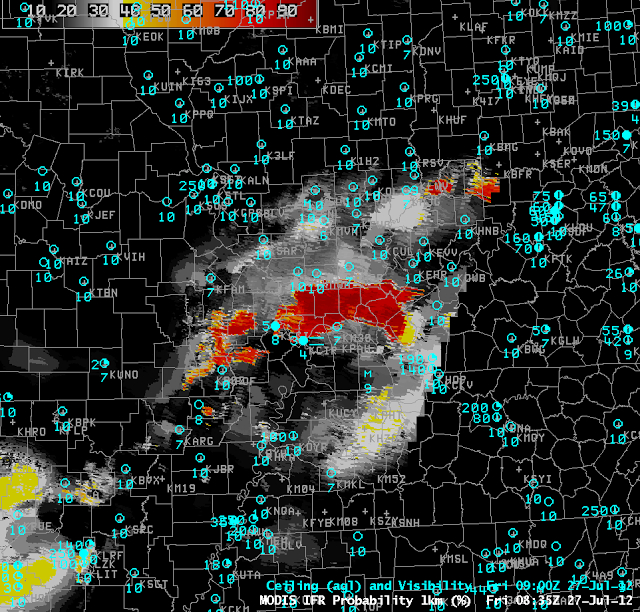
MODIS-based IFR probabilities at 0835 UTC.  Because western Kentucky is at the edge of the MODIS scan, some bow-tie correction artifacts are present.  Nevertheless, high probabilities nicely correspond to observations of reduced visibilities/ceilings.

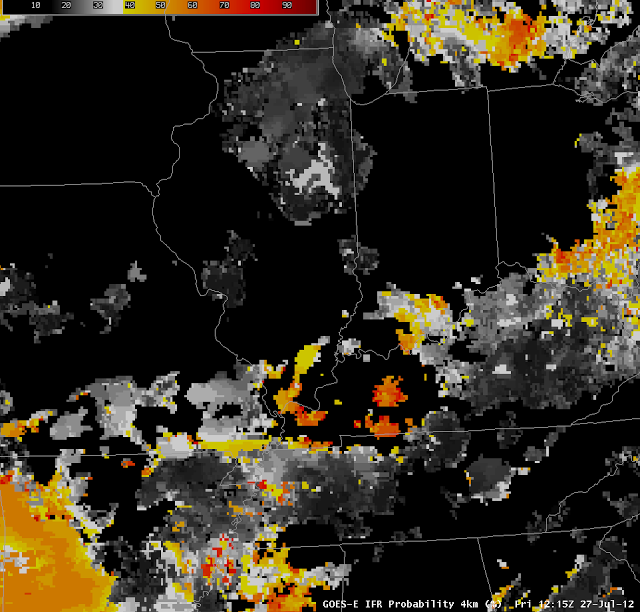
Note that this is occurring in a region of fog as evidenced by the MODIS-based IFR probabilities at 0900 UTC (above).  The image at 1215 UTC (below), 30 minutes after the end of the animation above, shows how the IFR probabilities have evolved as the sun rises.

GOES-R IFR Probabilities as computed from GOES-East information, 1215 UTC on 27 July 2012.

Benefit of Fused product

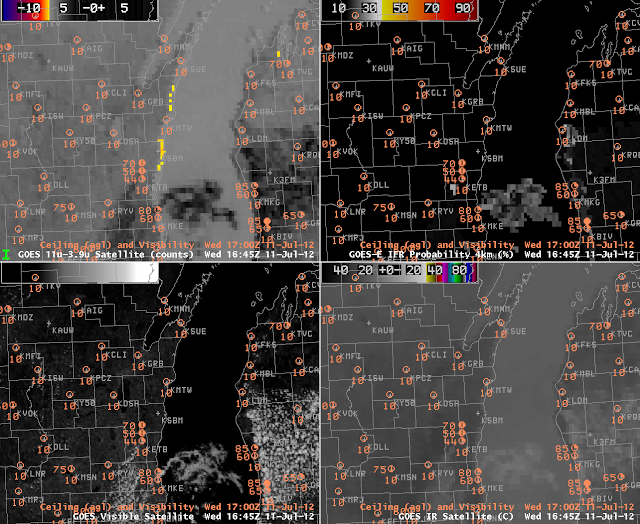
The brightness temperature difference product that can be used to infer the presence of fog/low clouds exploits emissivity differences in water clouds at 3.9 micrometers vs. 11 micrometers.  When the two bands have a co-registration error, as documented here, however, a false signal can arise.  A benefit of using a fused product is that the false signal is checked against a cloud mask and model data so that false positives can be identified and ignored.