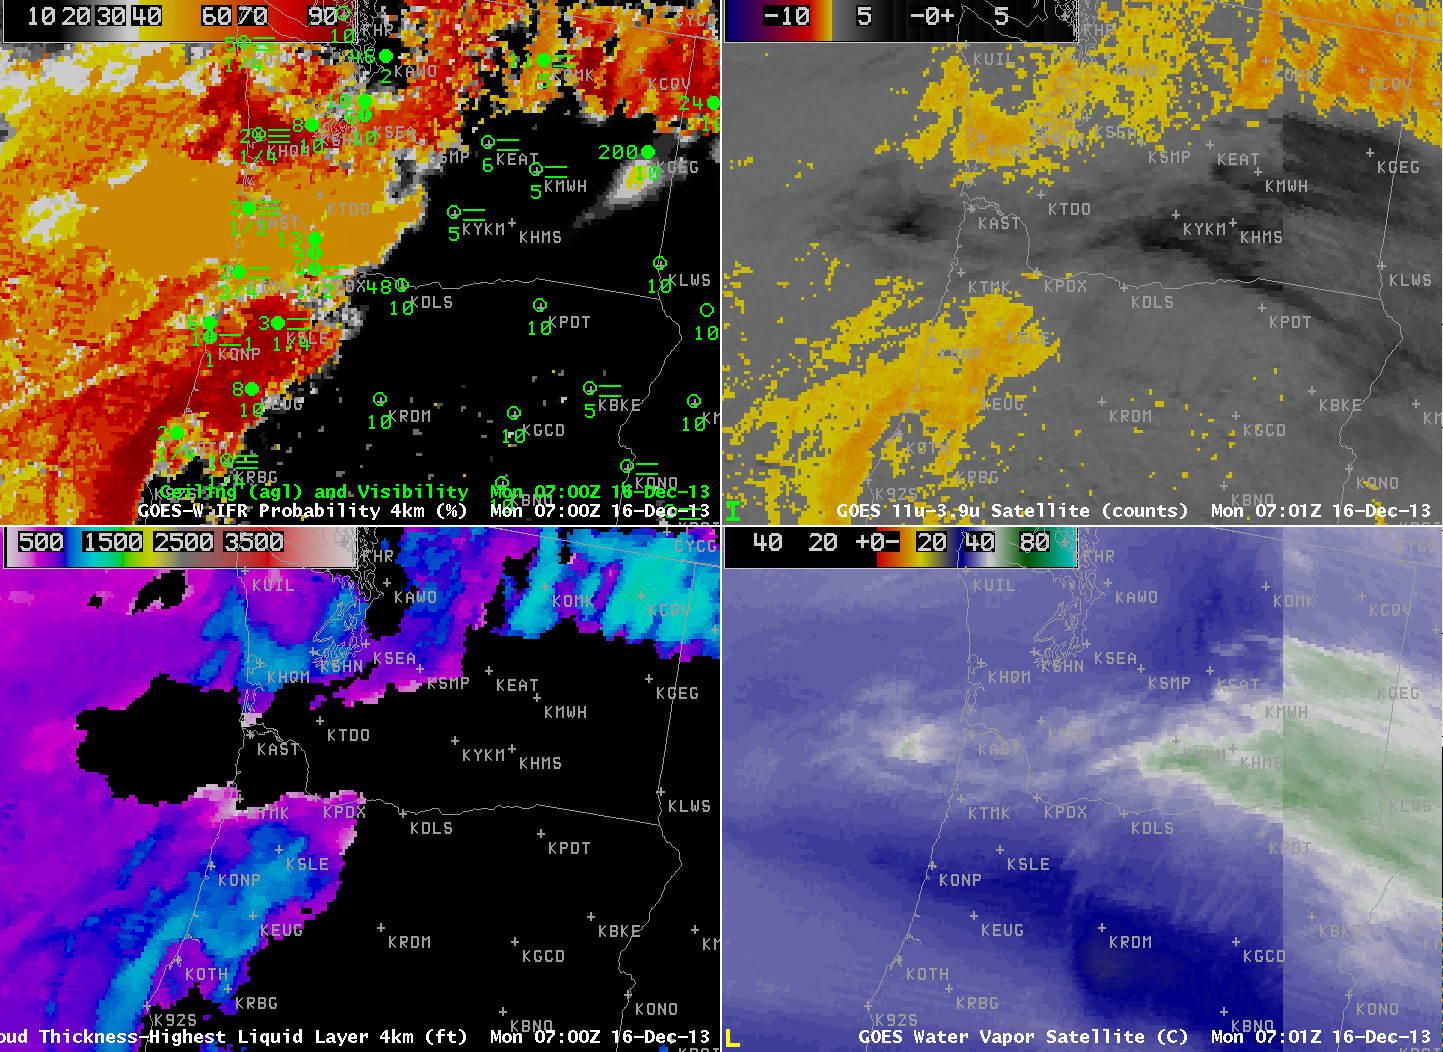
GOES-R IFR Probabilities from GOES-15 (upper left), GOES-15 and GOES-13 Brightness Temperature Difference (10.7 µm – 3.9 µm) Fields (upper right), GOES-R Cloud Thickness from GOES-15 (lower left), GOES-13 and GOES-15 6.7 µm enhanced water vapor imagery (lower right), all at ~0700 UTC 16 December 2013 (click image to enlarge)
High clouds in the atmosphere limit the ability of satellites to sense the presence of low clouds, as this example from December 16 2013 on the coast of Oregon demonstrates. Both the brightness temperature difference product and the water vapor imagery show signatures that accompany high cirrus. When cirrus is present, the brightness temperature difference field cannot be used to isolate regions of fog and low stratus because the satellite is detecting radiation from the highest emitting surface (the cirrus) not the fog/low stratus beneath. The IFR Probability field, however, uses both cloud information and Rapid Refresh Data, and the model data can fill in regions where satellites give no useful information, such as the lower Columbia River Valley around Astoria. Because satellite data are not used as a predictor, probabilities are lower. Remember how the presence of high clouds affects things when you interpret the IFR Probability fields.
GOES-R Cloud Thickness is not computed under high clouds. The GOES-R Cloud Thickness is the thickness of the highest water-based cloud deck. If a cirrus deck is present, or if twilight conditions are present, GOES-R Cloud Thickness is not computed.