 |
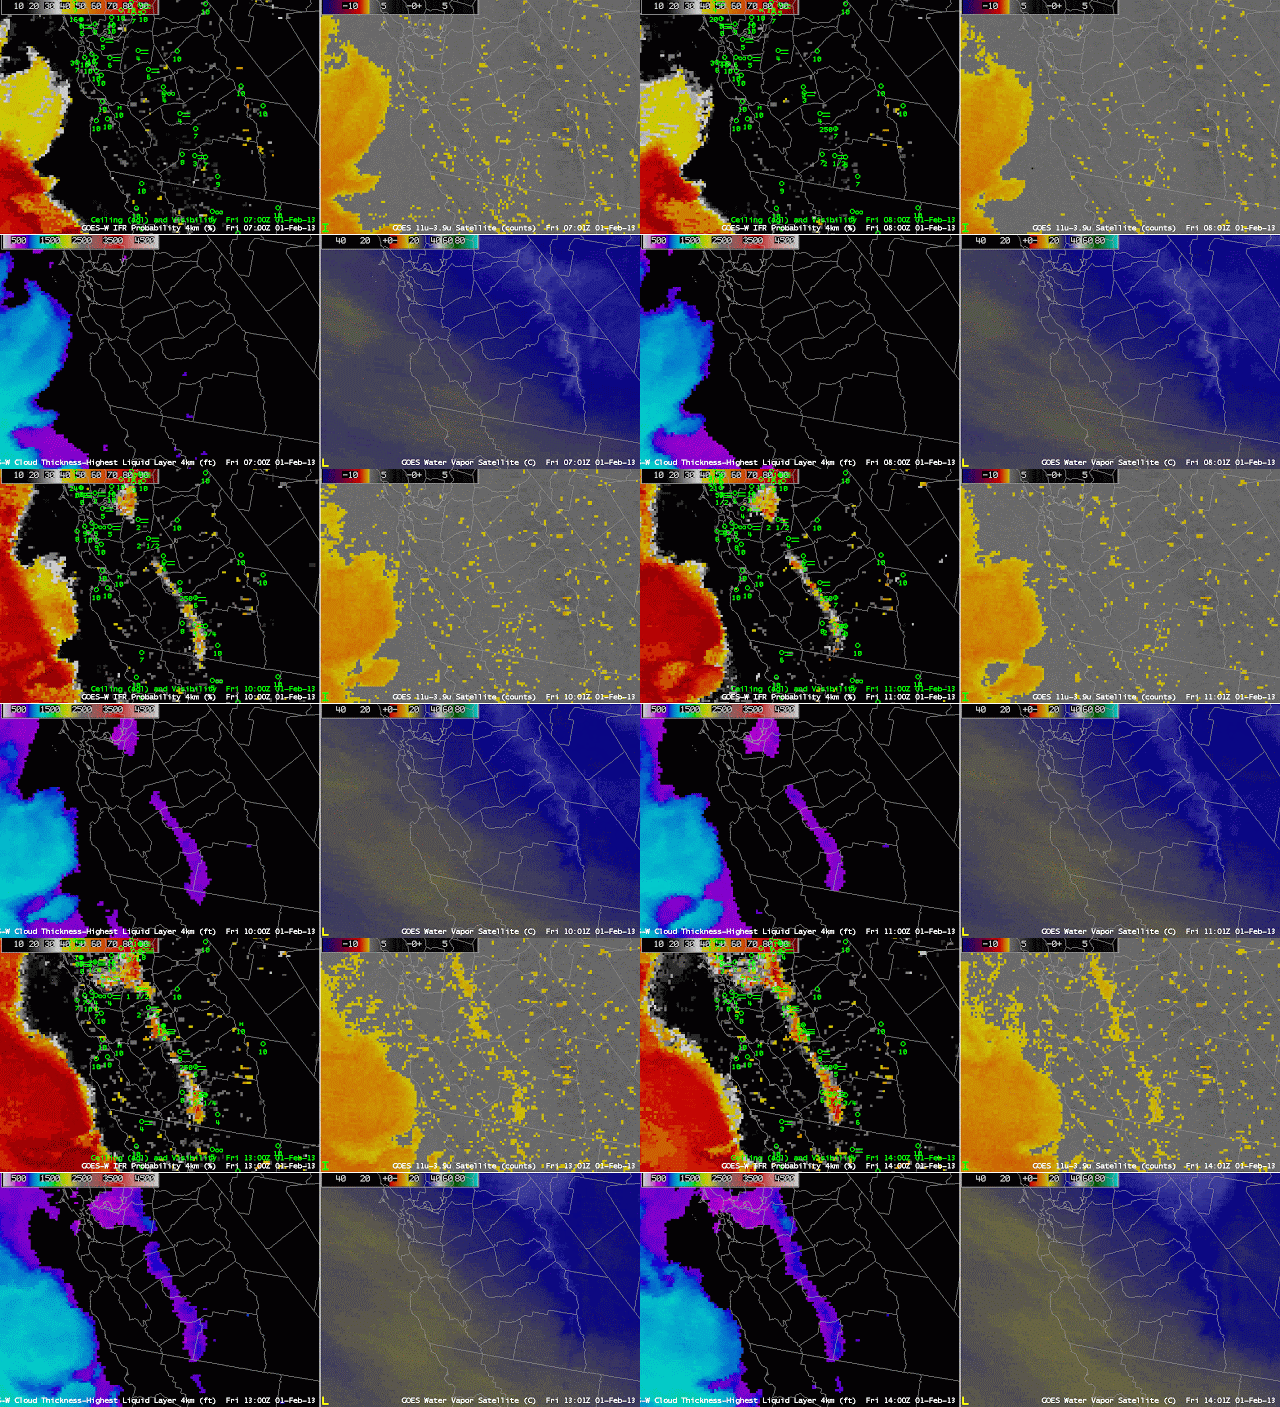
| GOES-R IFR Probabilities (Upper Left), GOES-West Brightness Temperature Difference (10.7 µm – 3.9 µm) (Upper Right), GOES-R Cloud Thickness (Lower Left), GOES-West Water Vapor imagery (6.7 µm) |
Fog developed in the early morning of February 1, 2013, in California’s Central Valley, the combination of the San Joaquin valley to the south and the Sacramento Valley to the north. The imagery above shows the GOES-R Fog/Low Stratus product and the traditional fog product, the brightness temperature difference between 10.7 µm and 3.9 µm. The GOES-R Product (IFR Probability) is first in highlighting the development of fog near the San Joaquin River and reductions in visibility occur in sync with the increase of IFR probabilities. The traditional GOES-West brightness temperature difference product displays considerable signal in the first hours of the animation above, but there is no organization to the signal. Eventually, however, the brightness temperature difference signal does include the fog and low stratus in the Valley.
