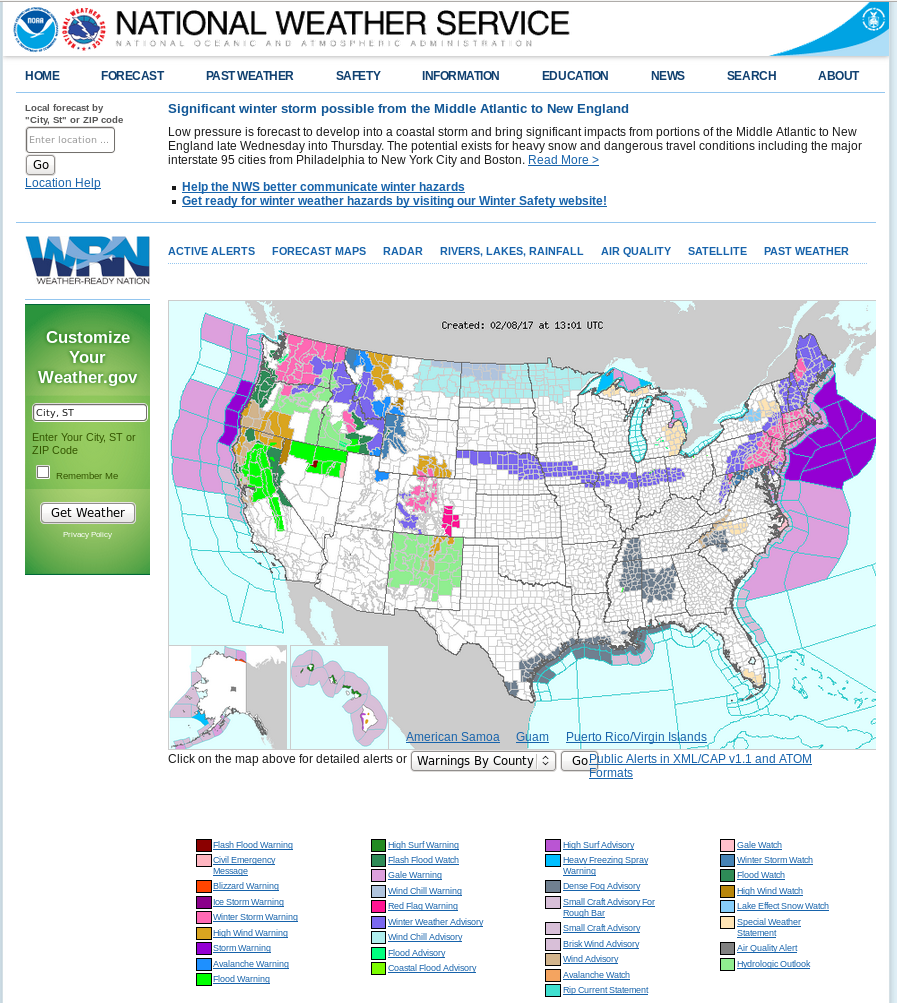
GOES-R IFR Probability fields, hourly from 0145-1345 UTC on 08 February 2017, along with surface observations of visibility and ceiling height (Click to enlarge)
Dense Fog developed along the western Gulf Coast early on the morning of 8 February 2017, leading to the issuance of Dense Fog Advisories (graphic from this site) and of IFR Conditions (graphic from this site). The animation above shows the expansion of the field of high IFR Probabilities northwestward from the Gulf of Mexico starting at 0145 UTC. IFR Conditions reported in concert with the arrival of higher IFR probabilities. Relatively high IFR Probability values also develop over northern MIssissippi and Alabama.
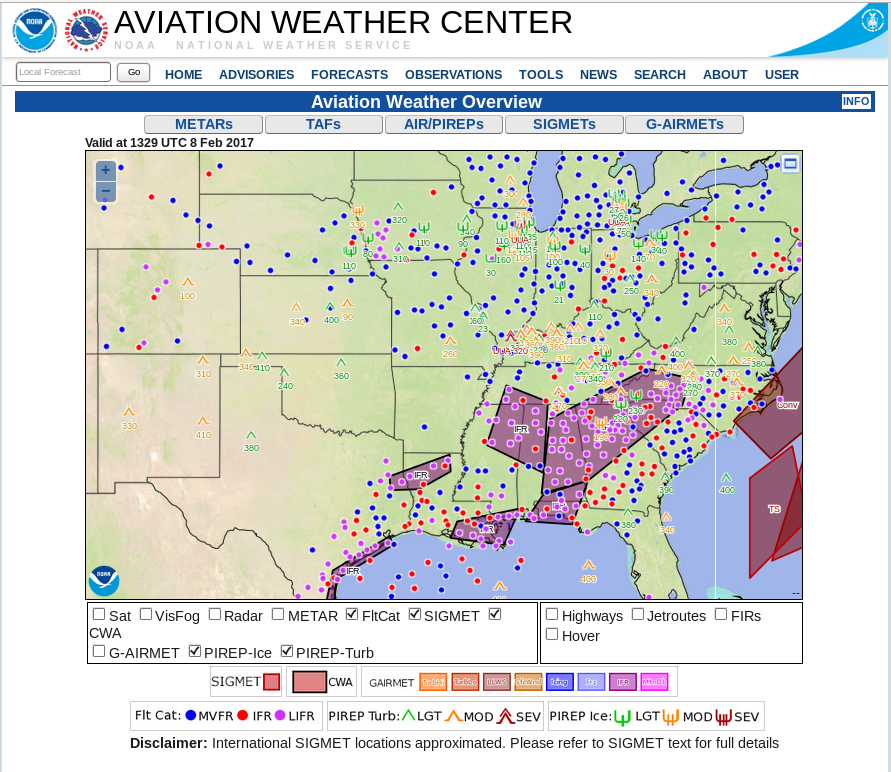
The traditional method of detecting low clouds at night, the brightness temperature difference field computed using brightness temperatures at 3.9 µm and 10.7 µm detects water-based clouds because of the different emissivity properties of the water-based cloud at those two wavelengths. If ice clouds (at high levels) or mixed phase clouds (at mid-levels) exist, however, the satellite cannot view the low clouds. This was the case on 8 February over northern Mississippi and northern Alabama, and also occasionally over Louisiana and Texas. The toggle below from 0945 UTC, between the GOES-R IFR Probability field and the Brightness Temperature Difference field, shows several regions where Brightness Temperature Difference field enhancements do not indicate low clouds (over northwestern Mississippi, for example); in these regions, IFR Probabilities are nevertheless large because Rapid Refresh model data shows saturation in the lowest 1000 feet of the atmosphere, strongly suggestive of high IFR Probabilities, and that predictor serves to increase the value of the IFR Probability. The animation of the Brightness Temperature Difference fields is at the bottom of this blog post; compare it to the IFR Probability fields at the top. The IFR Probability algorithm capably fills in regions under high clouds/mid-level clouds where the satellite cannot view low clouds. It gives a more consistent (and more accurate) depiction of the spread of the low clouds/fog.

Brightness Temperature Difference (3.9 µm – 10.7 µm) and GOES-R IFR probability at 0945 UTC on 8 February 2017 (Click to enlarge)
Another difficulty with Brightness Temperature Difference fields occurs around sunrise when increasing amounts of reflected solar radiation at 3.9 µm cause a sign change in the brightness temperature difference field (reflected 3.9 µm radiation increases as the sun rises and the computed brightness temperature therefore changes because reflected solar radiation at 10.7 µm is minimal; emissivity-related differences between the two bands are overwhelmed). The toggle below compares 1245 UTC and 1345 UTC Brightness Temperature Values.

Brightness Temperature Difference (3.9 µm – 10.7 µm) at 1245 and 1345 UTC on 8 February 2017 (Click to enlarge). Decreases in the brightness temperature differences occur at 1345 UTC because of increases in reflected solar radiation at 3.9 µm.
Brightness Temperature Difference (3.9 µm – 10.7 µm), 0145 – 1345 UTC on 8 February 2017, along with surface observations of ceilings and visibility (Click to enlarge)