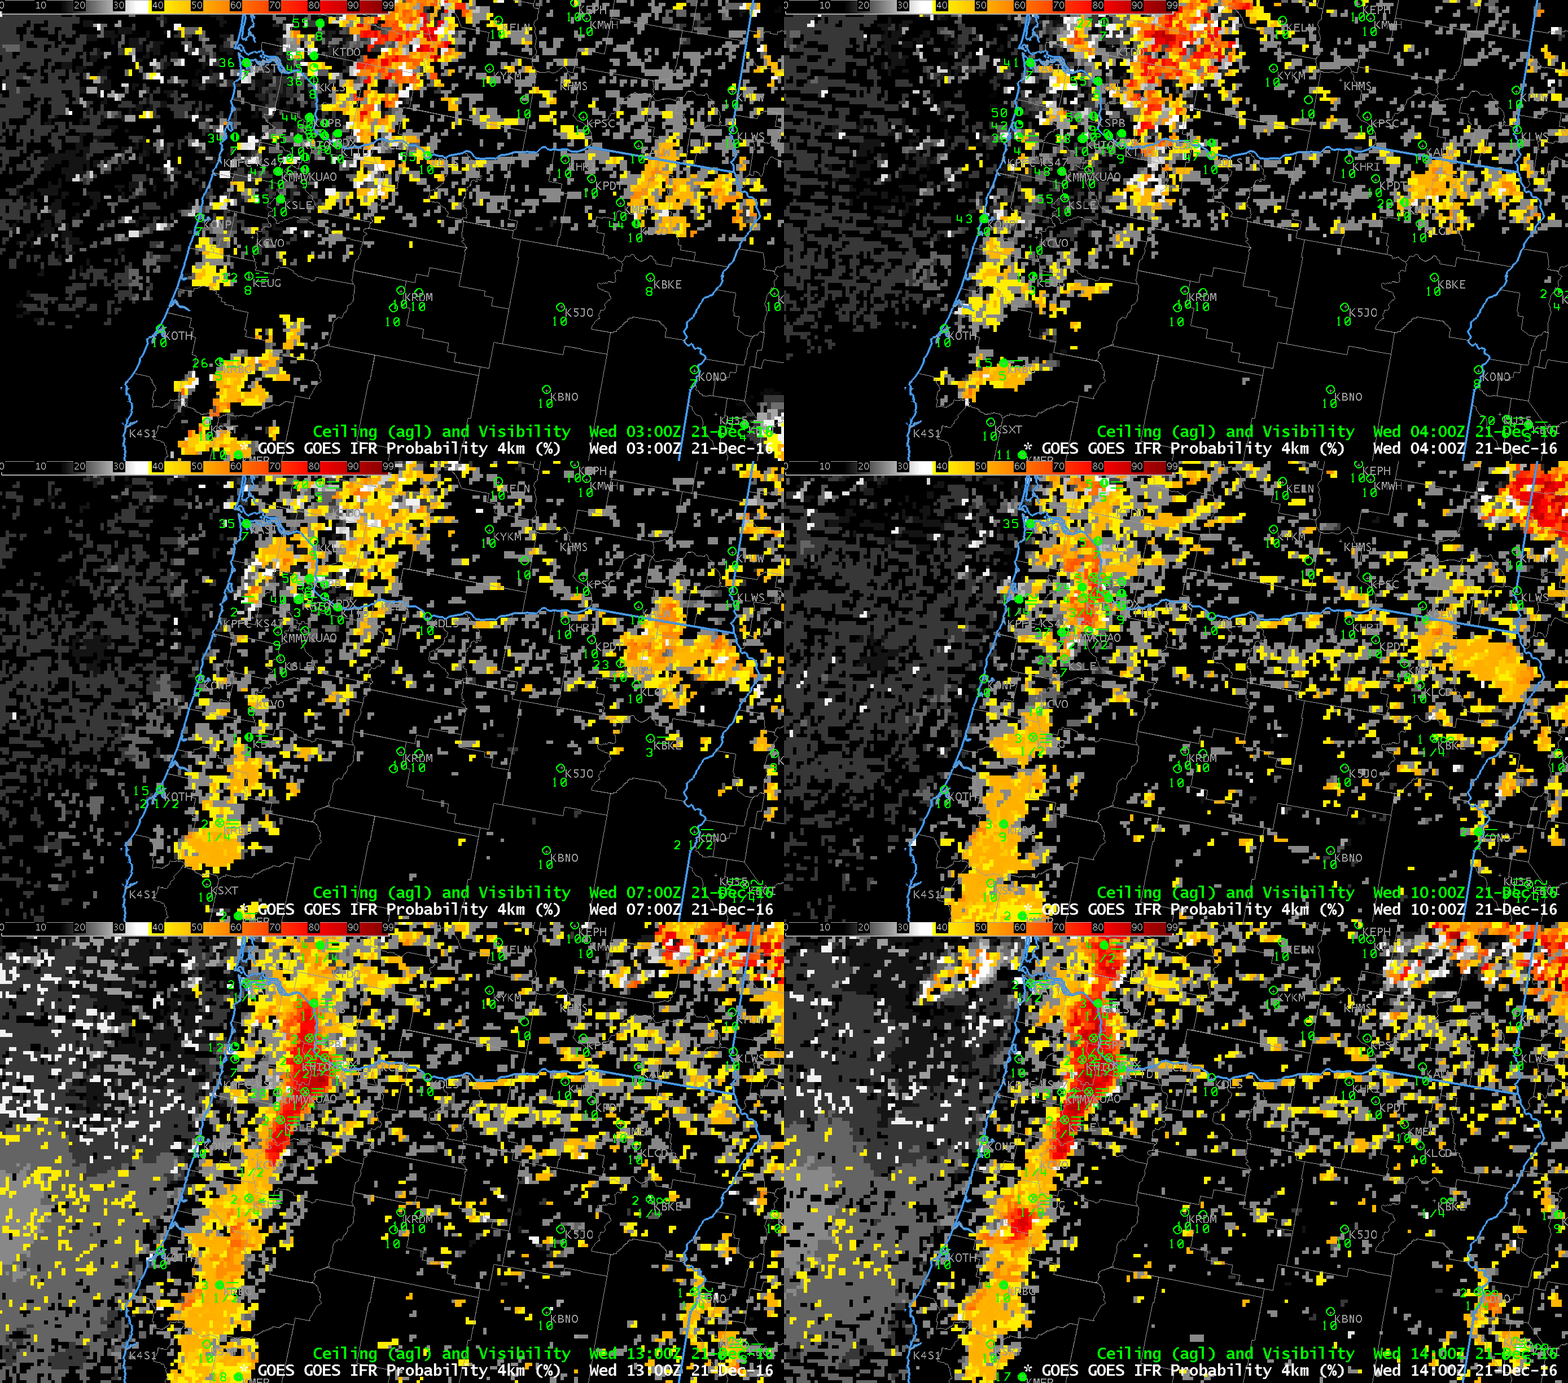
GOES-R IFR Probabilities computed with GOES-15 and Rapid Refresh Data, hourly from 0300 through 1400 UTC on 21 December 2016 (Click to enlarge)
Dense Fog developed in the Willamette Valley of western Oregon during the early morning hours of 21 December 2016. How did GOES-R IFR Probability fields and GOES-15 Brightness Temperature Difference (3.9 µm – 10.7 µm) Fields diagnose this event that led to the issuance of Dense Fog Advisories? The hourly GOES-R IFR Probability animation, above, shows increasing probabilities in the Willamette Valley, starting around Eugene (KEUG) and spreading northward until high probabilities cover the valley by 1400 UTC. IFR Conditions are first reported near Eugene, then through the entire valley by 1400 UTC. Widespread high IFR Probability values are not present elsewhere over Oregon (although they do exist over Washington State, where IFR conditions were also observed).
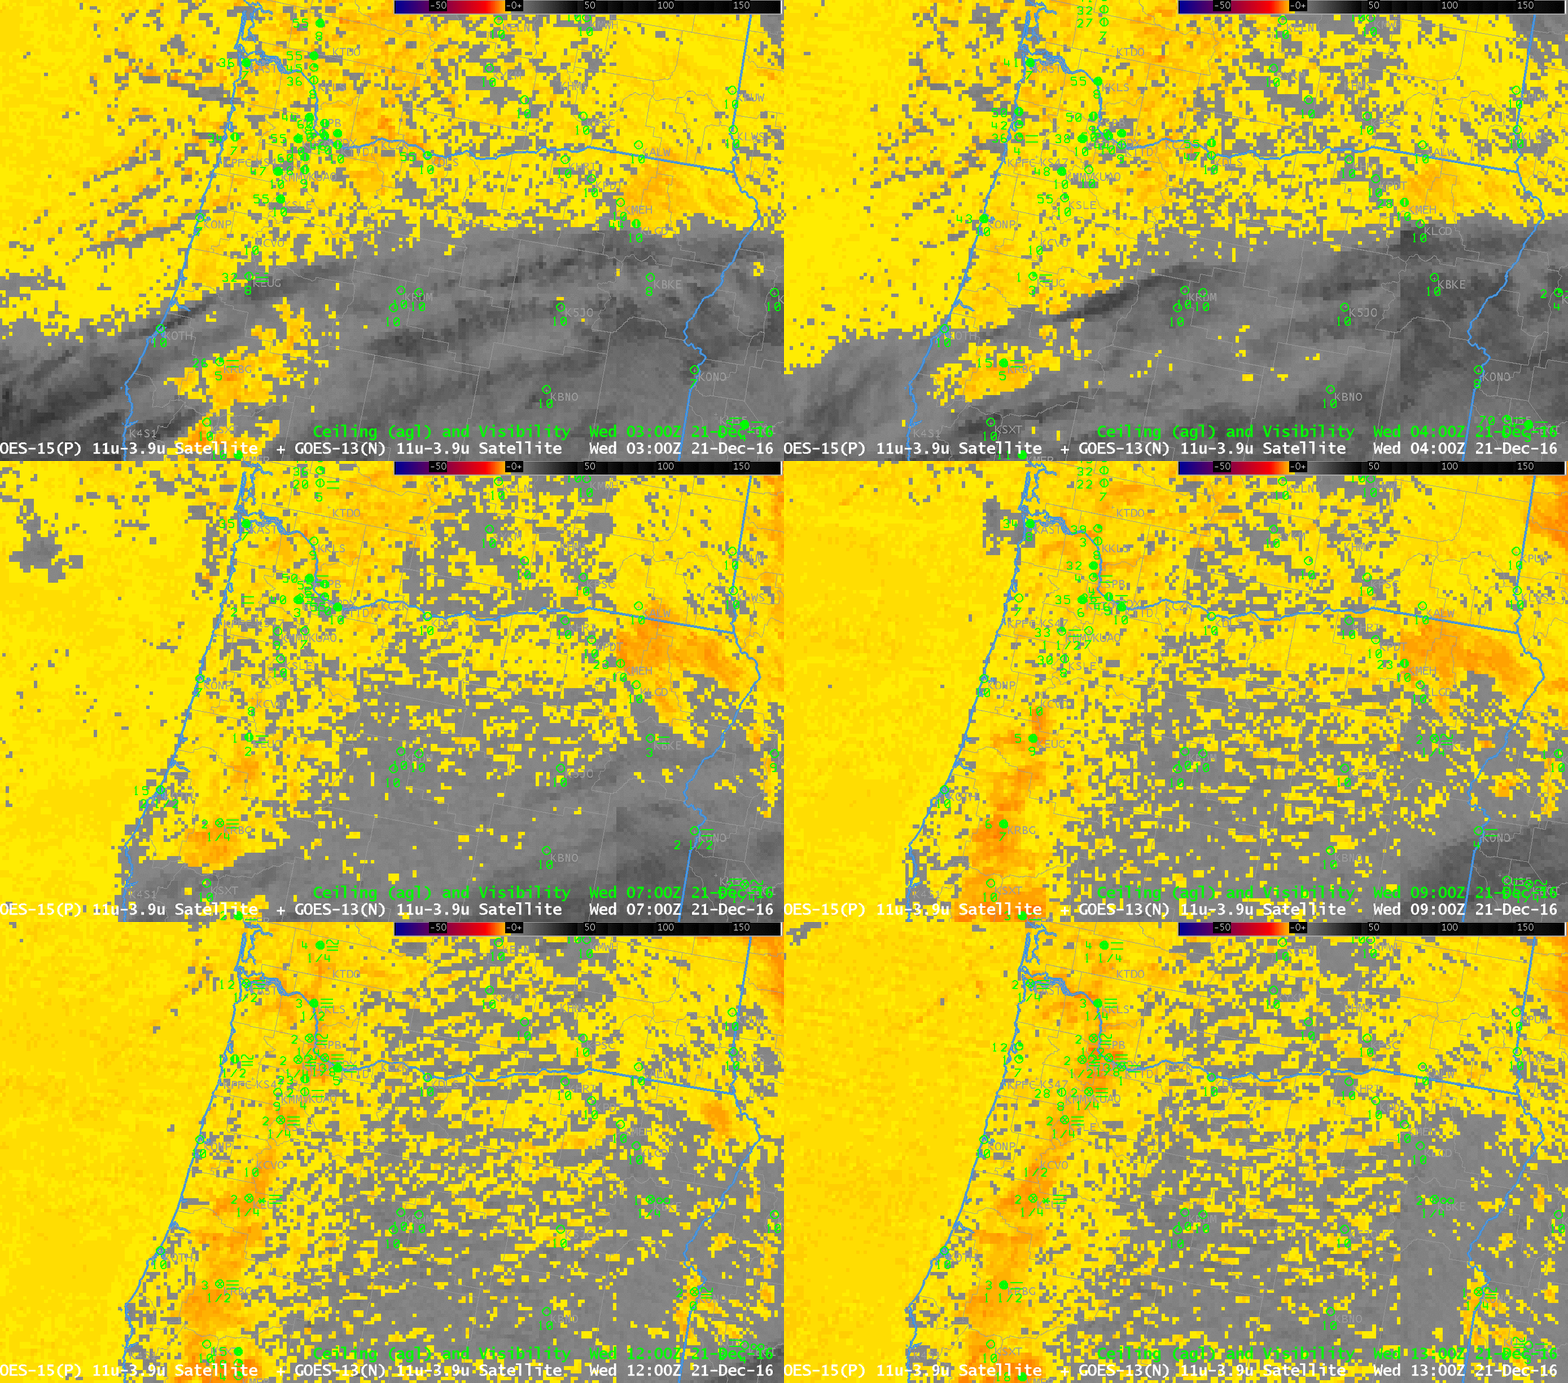
The Brightness Temperature Difference field (3.9 µm – 10.7 µm), below, shows a different distribution. Early in the animation a strong signal is apparent over much of northern Oregon, and also over the Pacific Ocean. Rapid Refresh output on low-level saturation is used in the GOES-R IFR probability algorithm to screen out regions where stratus that is detected by the satellite likely is not extending down to the surface — over the ocean, for example (coastal sites do not show IFR Conditions), or over much of eastern Oregon/Washington. Brightness Temperature Difference fields do eventually highlight the presence of fog in the Willamette Valley, but considerable regions outside the valley have a strong return and no indication of IFR conditions.

GOES-15 Brightness Temperature Difference (3.9 µm – 10.7 µm) fields, 0300-1300 on 21 December 2016 (Click to enlarge)
GOES-R IFR Probability fields will frequently (and correctly) screen out regions of strong returns in the Brightness Temperature Difference fields that do not correspond to surface obscuration of visibility and/or low ceilings.
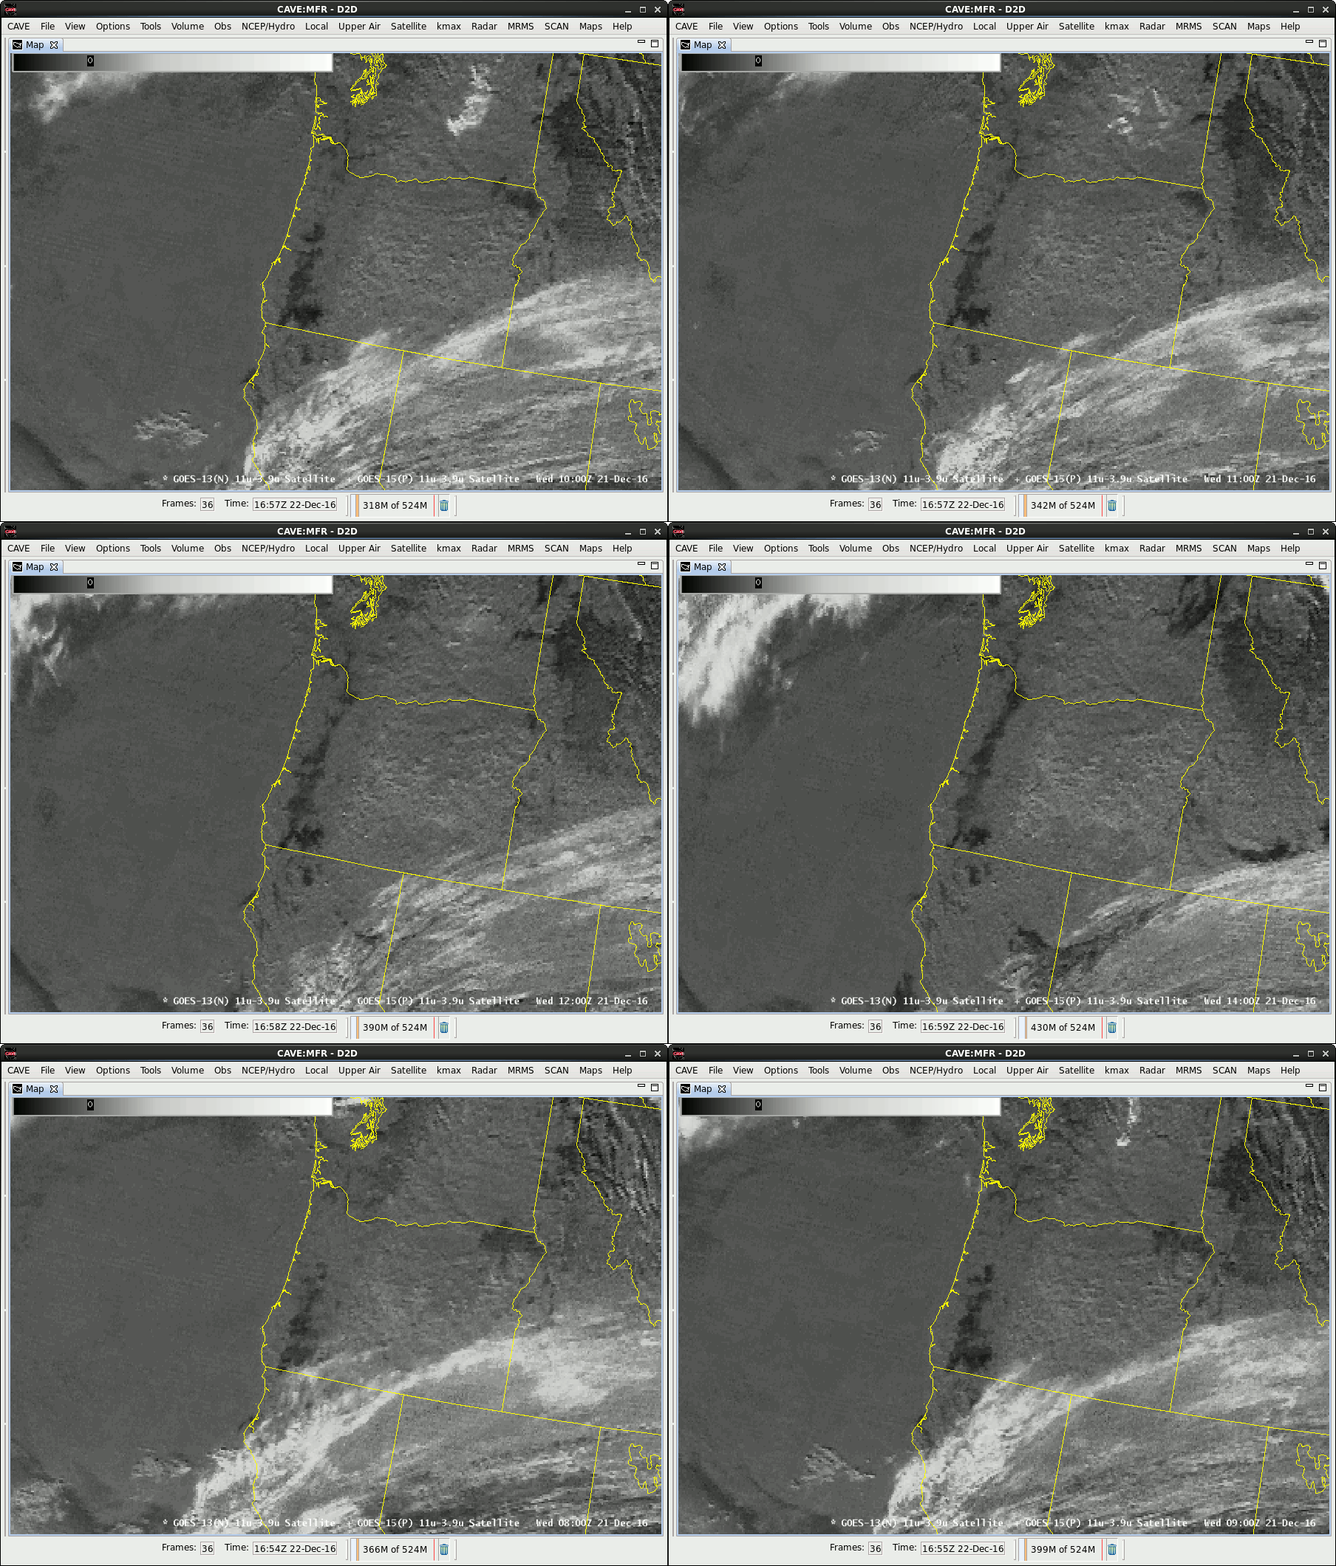
It is possible to alter the Brightness Temperature Difference Colormap, as below (animation courtesy Mike Stavish, SOO at Medford) to better highlight regions of fog in this case. Note in this enhancement the cirrus clouds appear white, rather than dark, as well.

GOES-15 Brightness Temperature Difference (3.9 µm – 10.7 µm) Fields, hourly from 0800 to 1400 UTC on 21 December 2016 (Click to enlarge)
The toggle below shows two color enhancements at 1200 UTC: the default version with many orange pixels, and an altered version that shows fewer pixels, mostly in regions where fog is present. A similar toggle for 0400 UTC is here.

