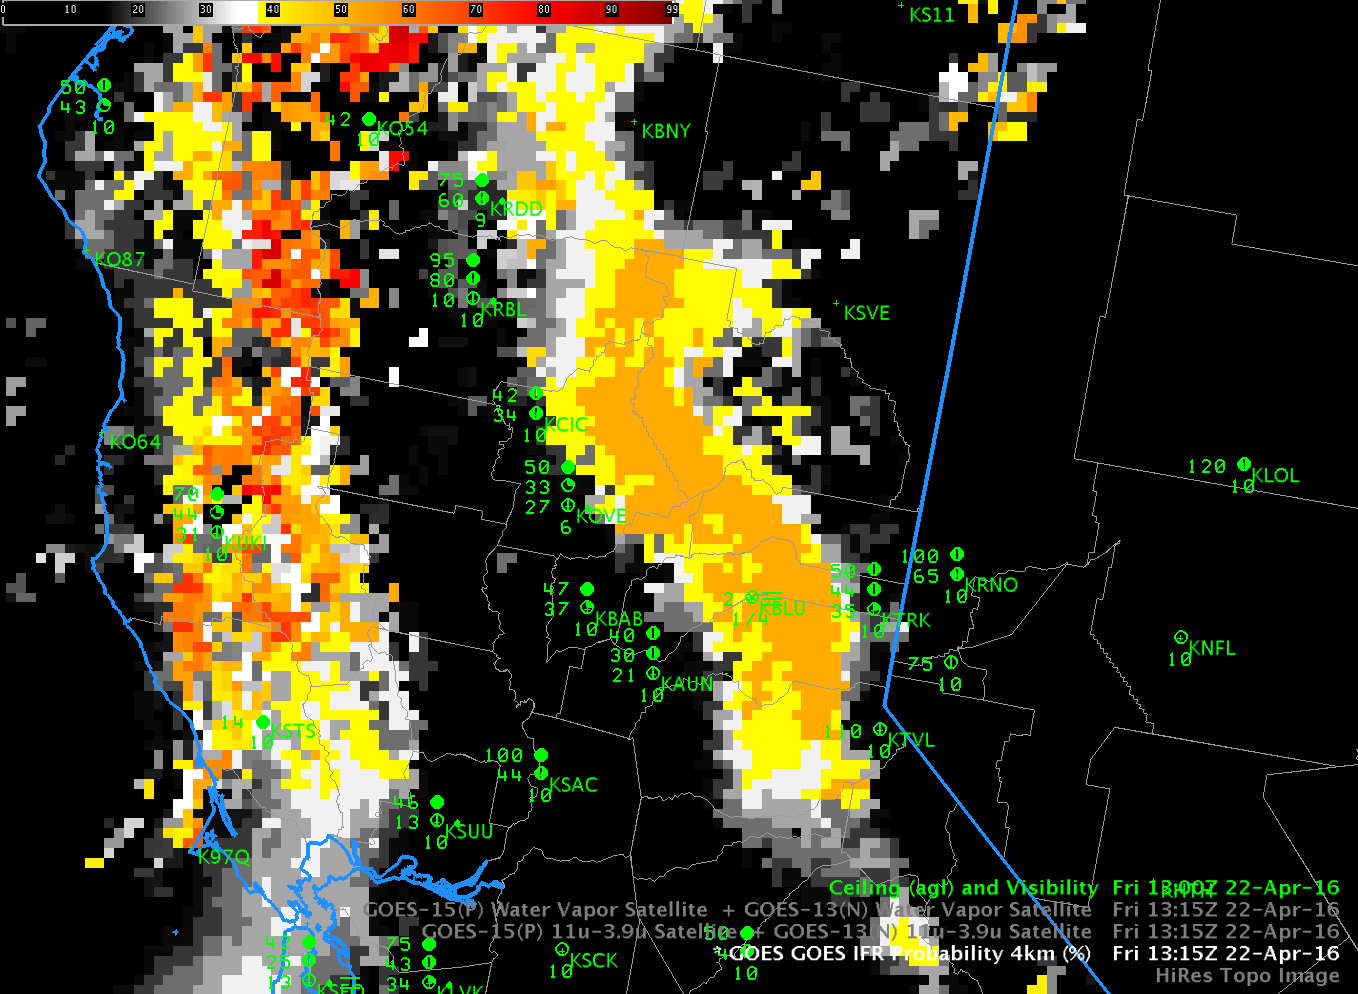
GOES-R IFR Probability Fields, 1315 UTC on 22 April 2016, along with surface observations of ceilings and visibilities (Click to enlarge)
The 1315 UTC image of GOES-R IFR Probabilities, above, shows an axis of higher probabilities aligned with the topography of the Sierra Nevada. Note that Blue Canyon (KBLU) is the sole station reporting IFR Conditions. Did conventional satellite data capture this event? The Water Vapor (6.5µm) and Brightness Temperature Difference fields (10.7µm – 3.9µm), below, do not show evidence of low clouds; indeed, the cirrus signature in the water vapor must mask any satellite observation of low clouds banked along the Sierra Nevada. Thus a fused product that combines model data and satellite data (such as IFR Probability fields) must be used, and the relatively flat nature of the IFR Probability field above confirms that Rapid Refresh information on low-level saturation is the reason why IFR Probability values are elevated along the mountains.
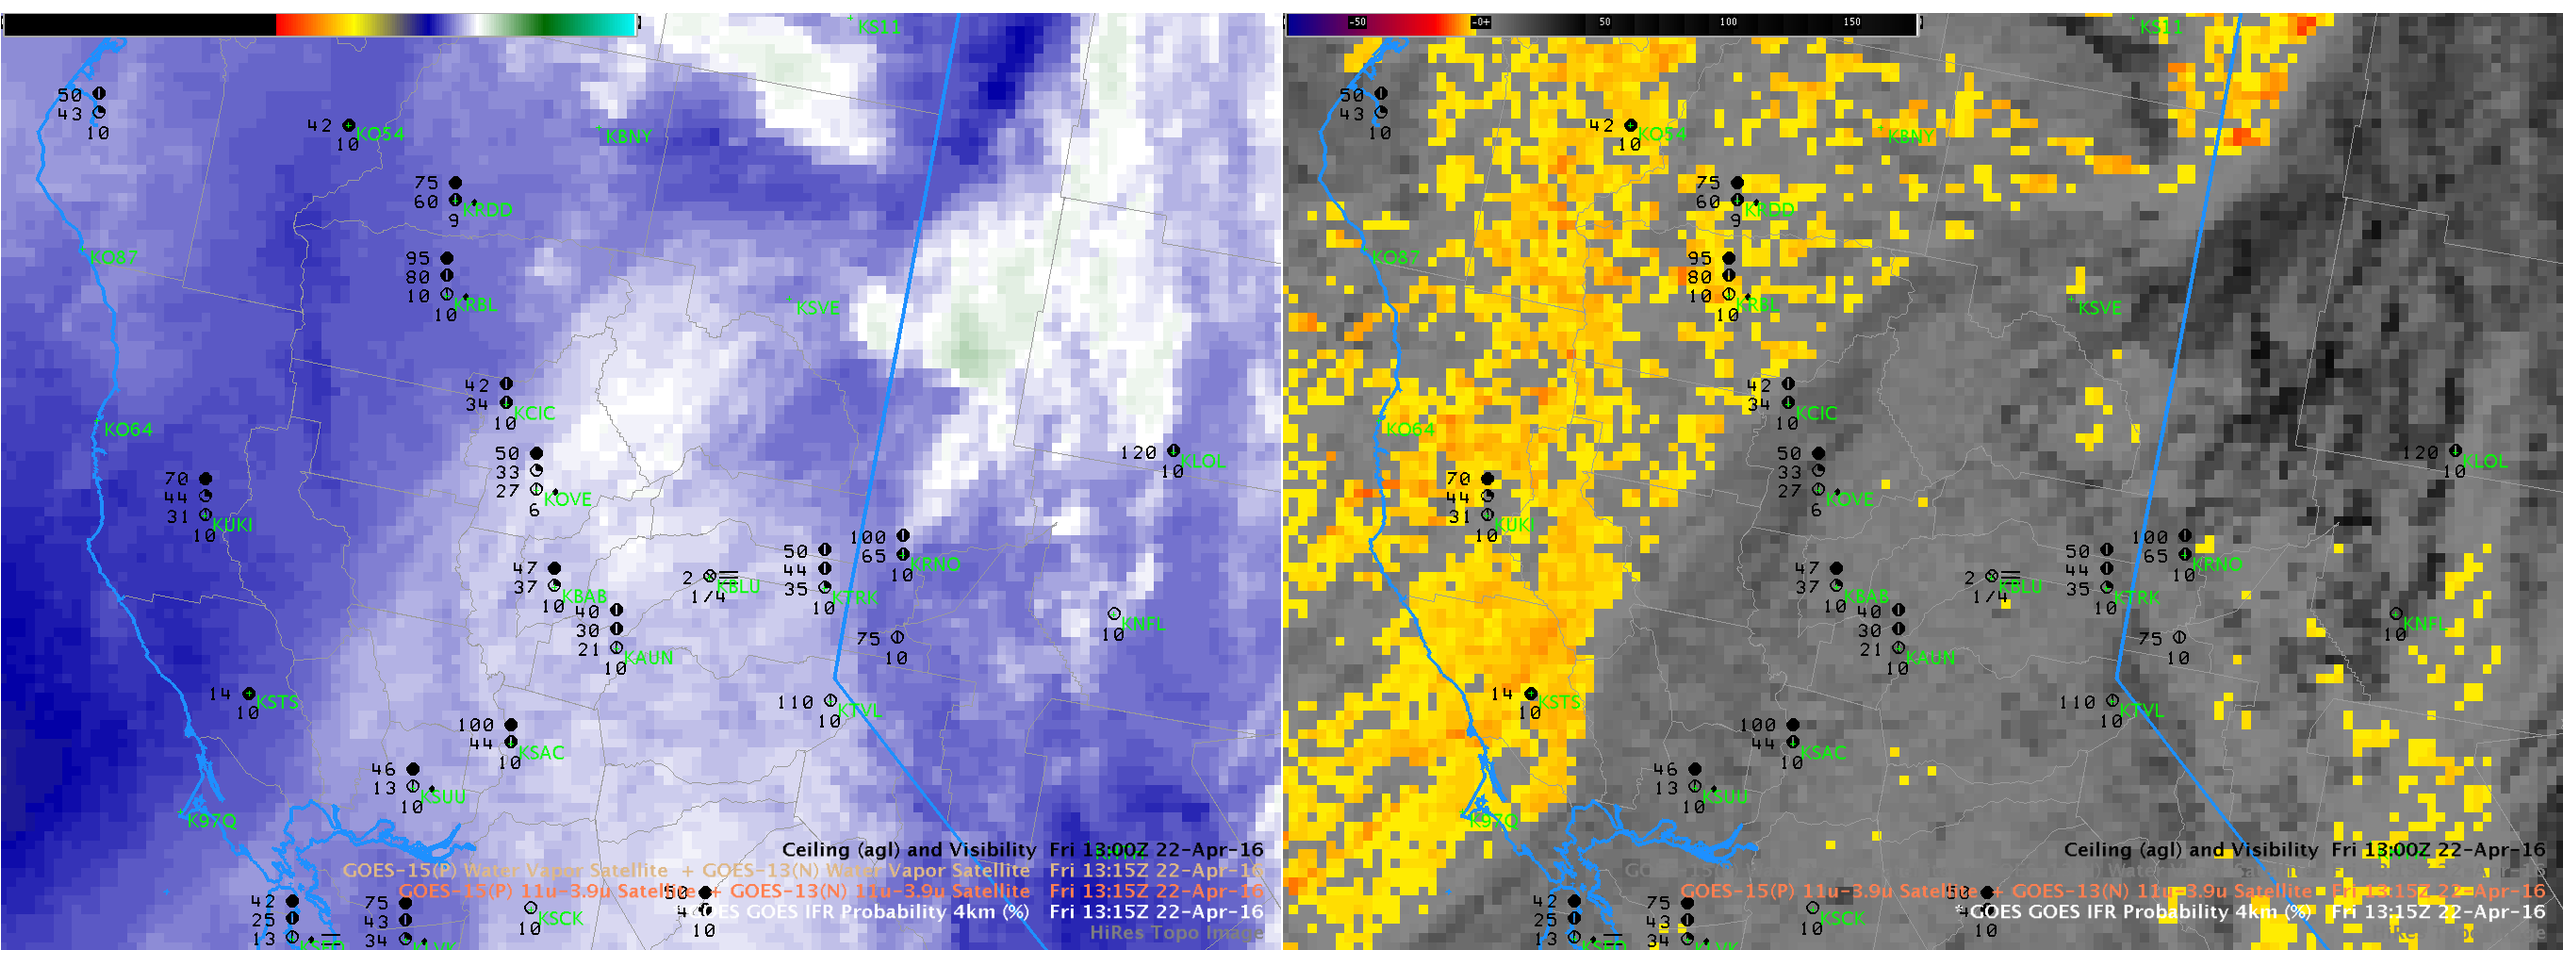
GOES-15 Water Vapor (6.5 µm), left, and GOES-15 Brightness Temperature Difference Field (10.7 µm – 3.9 µm), right, at 1315 UTC 22 April 2016 (Click to enlarge)
IFR Probability Fields earlier in the night did have a satellite component to them. The values at 0300 and 0600, below, show the gradual encroachment of cirrus from the south and west over the low clouds along the Sierra Nevada. After 0600 UTC, only model data were used over the Sierra as high-level cirrus blocked the satellite view.
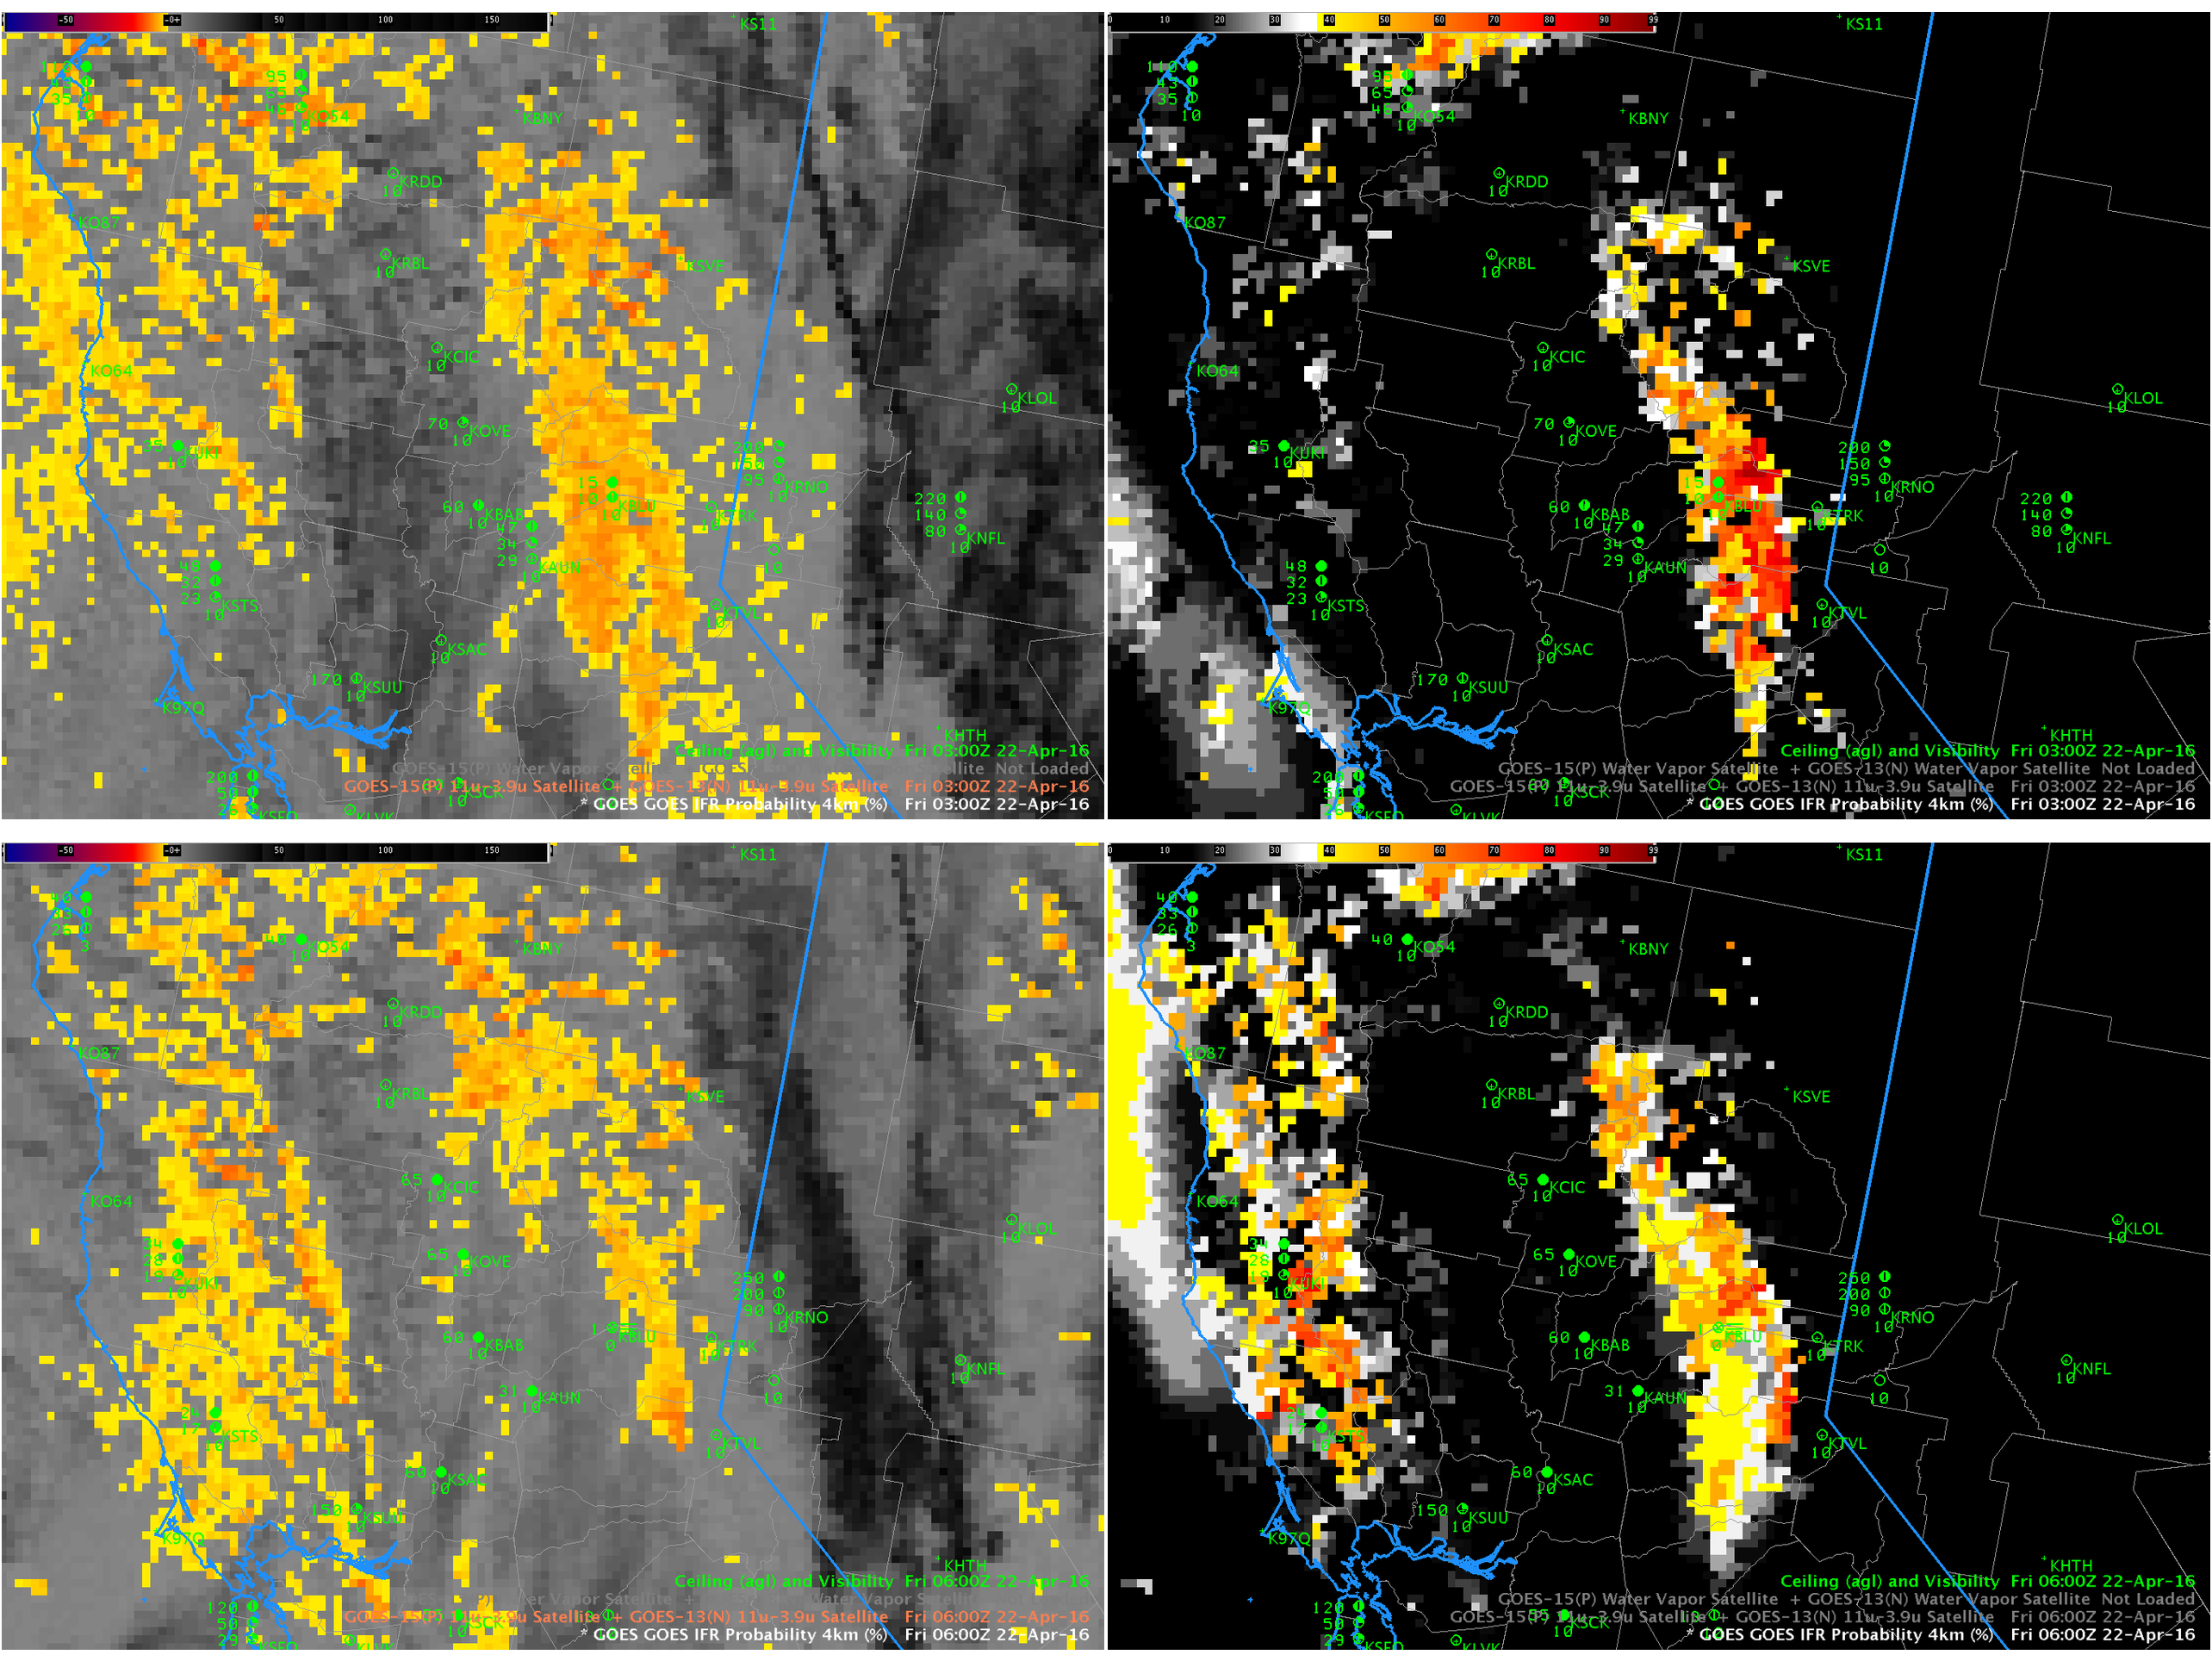
Brightness Temperature Difference (10.7µm – 3.9µm) Fields (Left) and GOES-R IFR Probaility Fields (Right) from 0300 (Top) and 0600 (Bottom) on 22 April 2016 (Click to enlarge)