 |
| GOES-R IFR Probabilities from GOES-East, hourly from 00:15 through 13:15 on 28 January 2013, with surface visibilities and ceilings. |
Warm and moist air streaming north from the southern Plains has encountered the cold (and in some places) snow-covered ground. This is a time-honored recipe for advection fog, and the GOES-R IFR Probabilities fields, above, neatly capture the horizontal extent of the visibility restrictions overnight. The highest IFR Probabilities occur in regions where both Satellite Predictors and Model-based predictors are high. Note, for example, the somewhat lower probabilities that develop over Nebraska at the end of the animation. This is a region where higher clouds are moving in.
 |
| GOES-R IFR Probabilities (Upper Left), GOES-East Brightness Temperature Difference (10.7 µm – 3.9 µm) (Upper Right), GOES-R Cloud Thickness (Lower Left), GOES-East 10.7 µm Brightness Temperature (Lower Right) |
Note how the Cloud Thickness product is not computed where the higher clouds are moving in. The product is computed only where single layer clouds are present in non-twilight conditions. Twilight conditions are present in the eastern half of the final image, at 1315 UTC. When radiation fog is present (rather than advection fog in this case), the last cloud thickness before twilight conditions can be used to estimate dissipation time using this chart.
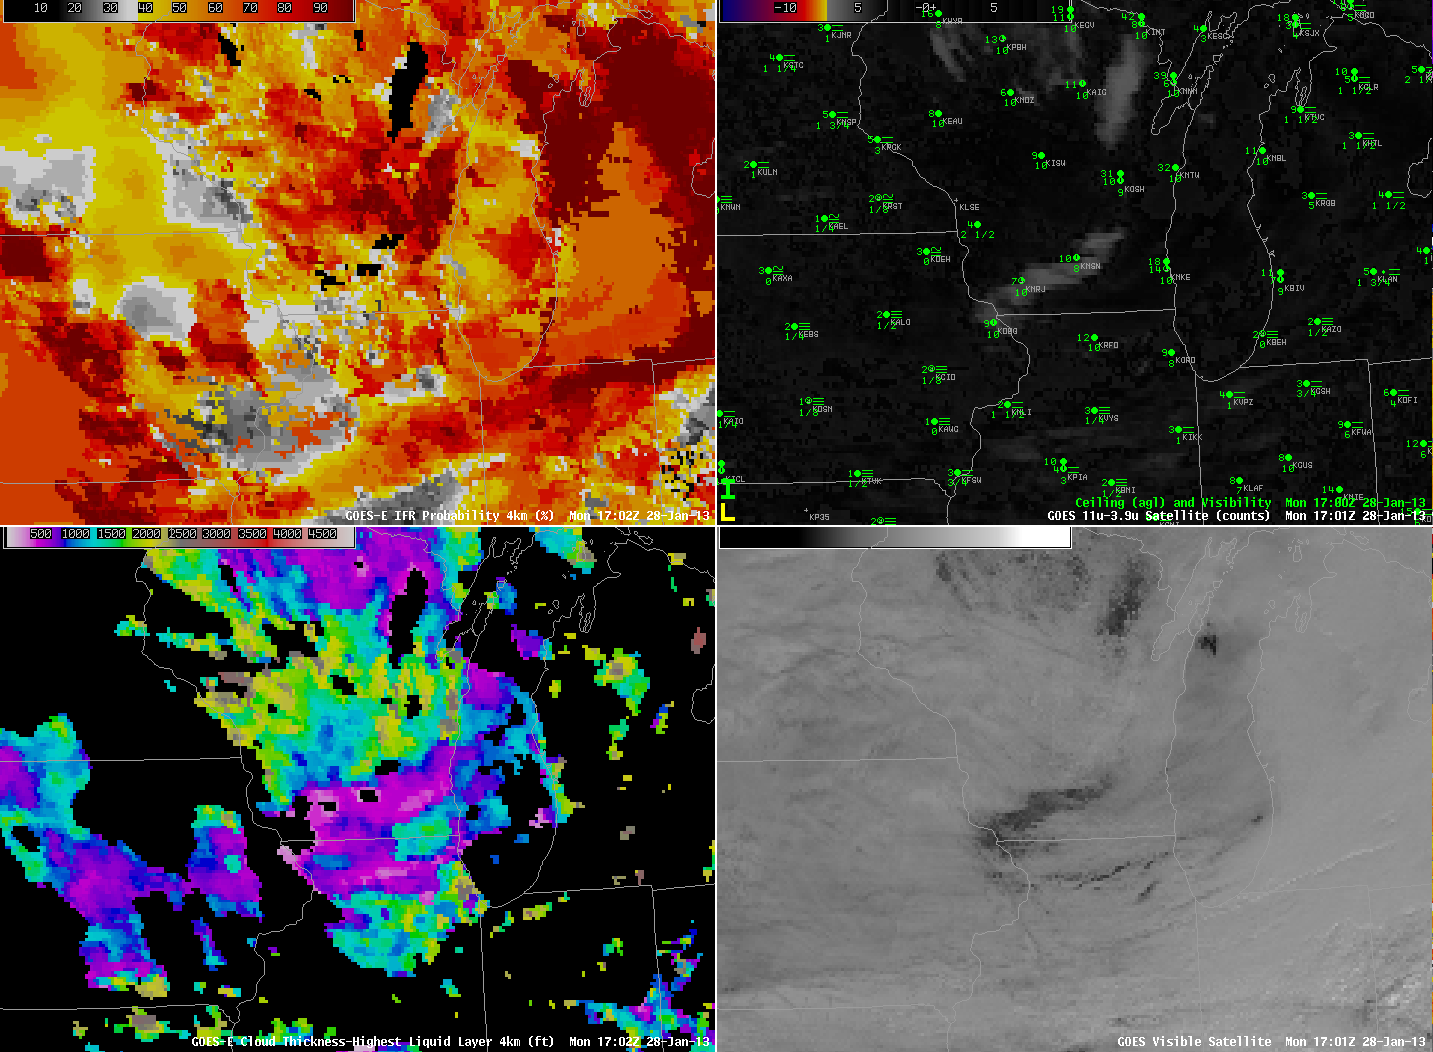 |
| GOES-R IFR Probabilities (Upper Left), GOES-East Brightness Temperature Difference (10.7 µm – 3.9 µm) (Upper Right), GOES-R Cloud Thickness (Lower Left), GOES-East Visible Imagery (0.62 µm) (Lower Right) |
Holes in the advection fog developed around 1700 UTC.