 |
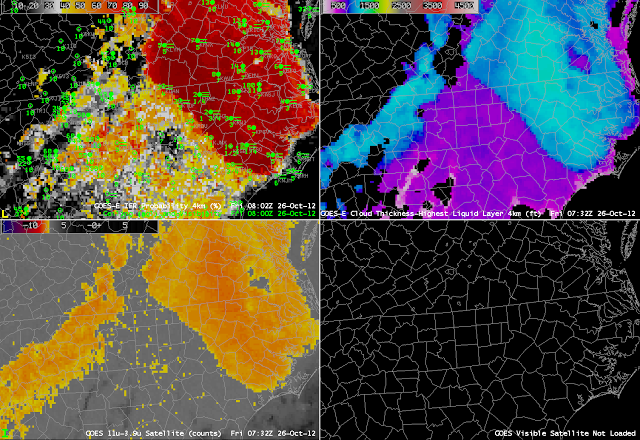
| GOES-R IFR Probability (Upper Left), GOES-R Cloud Thickness (Upper Right), GOES-East Brightness Temperature Difference (10.8 µm – 3.9 µm) (Lower Left), GOES-East Visible Imagery (Lower Right) at 0800 UTC 26 October 2012 |
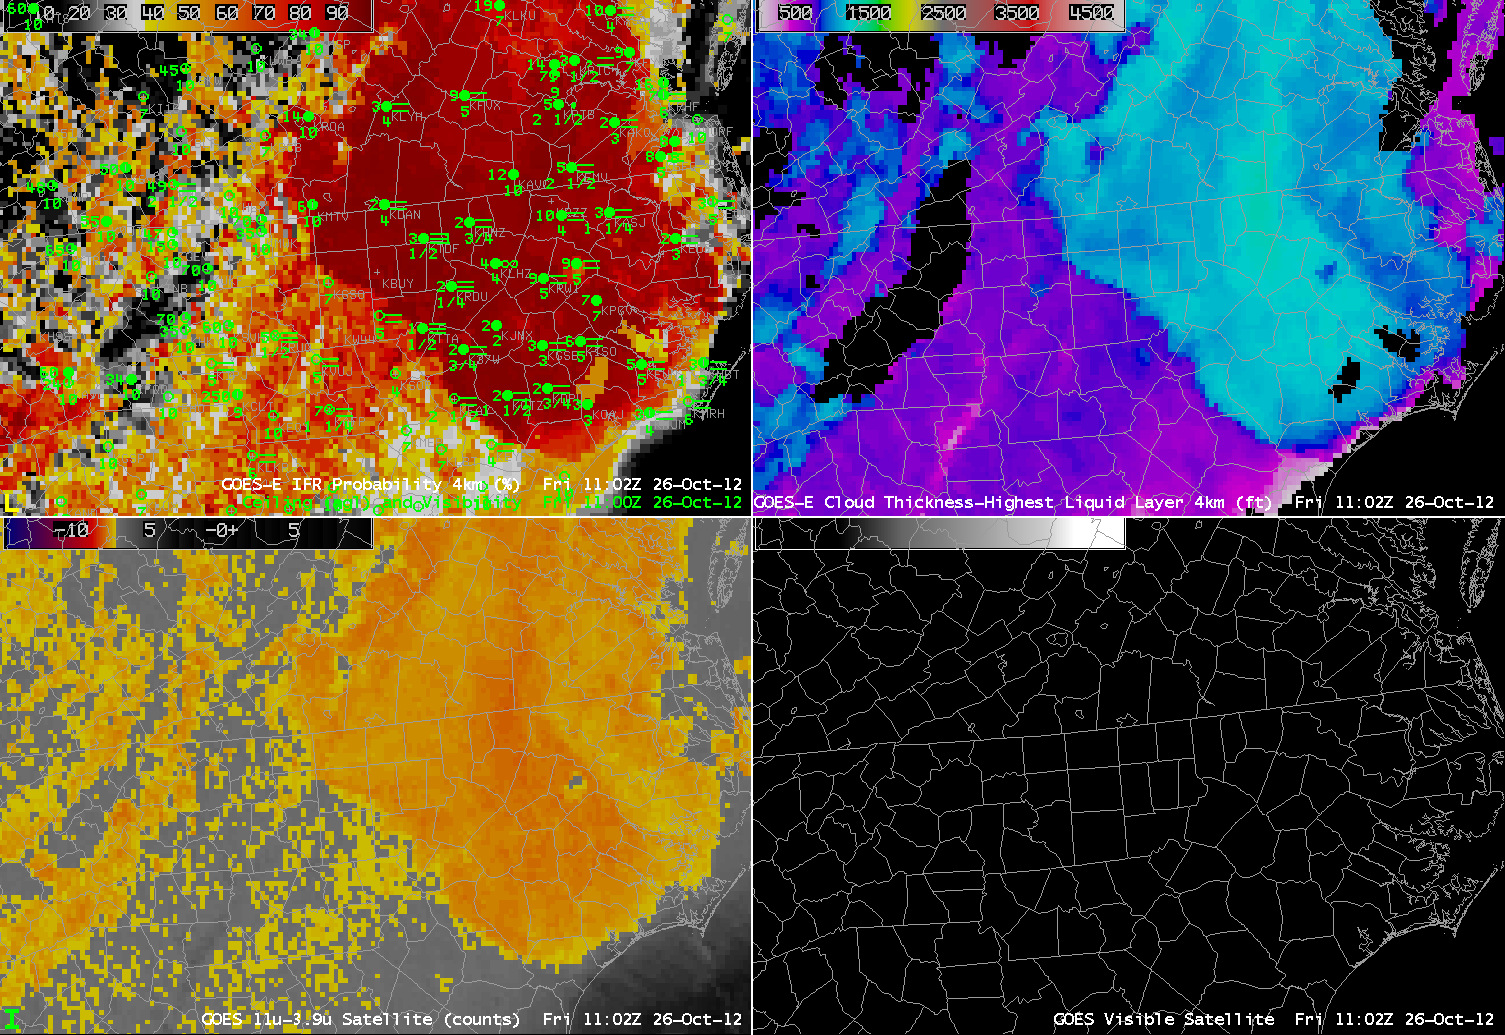
The marine stratus over the mid-atlantic on Oct 25th (Link) has continued to spread southwestward into North Carolina, and higher values in the IFR probability fields continue to overlap nicely with observed IFR conditions in the Piedmont of North Carolina. The image above at 0800 UTC, and below at 1100 UTC, show deteriorating flight conditions as the high probabilities ooze southwestward. Note that the traditional brightness temperature difference field does show a signature of the cirrus outflow from Hurricane Sandy off the coast of the Carolinas, in the extreme southeast part of the images, both at 0800 UTC and 1100 UTC.
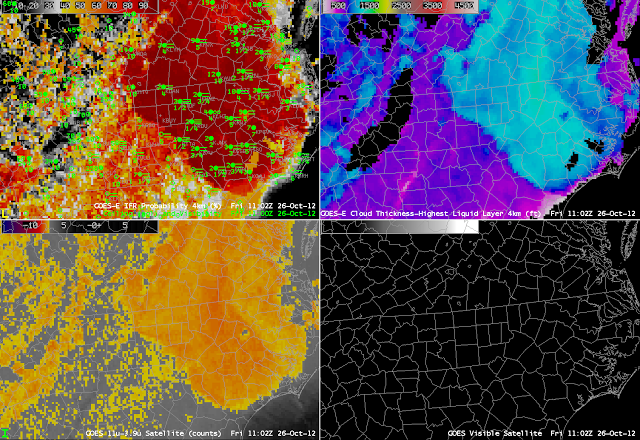 |
| GOES-R IFR Probability (Upper Left), GOES-R Cloud Thickness (Upper Right), GOES-East Brightness Temperature Difference (10.8 µm – 3.9 µm) Lower Left), GOES-East Visible Imagery (Lower Right) at 1100 UTC 26 October 2012 |
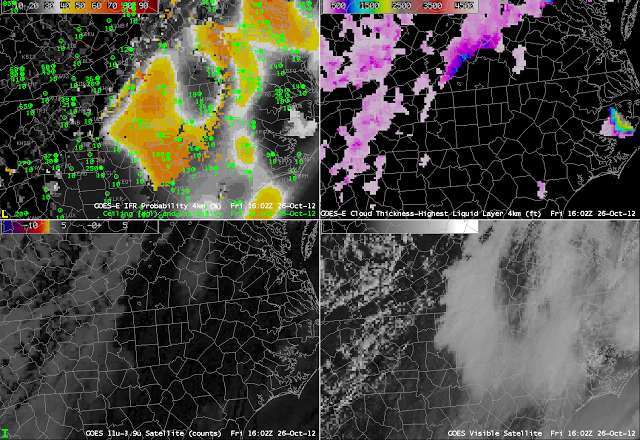 |
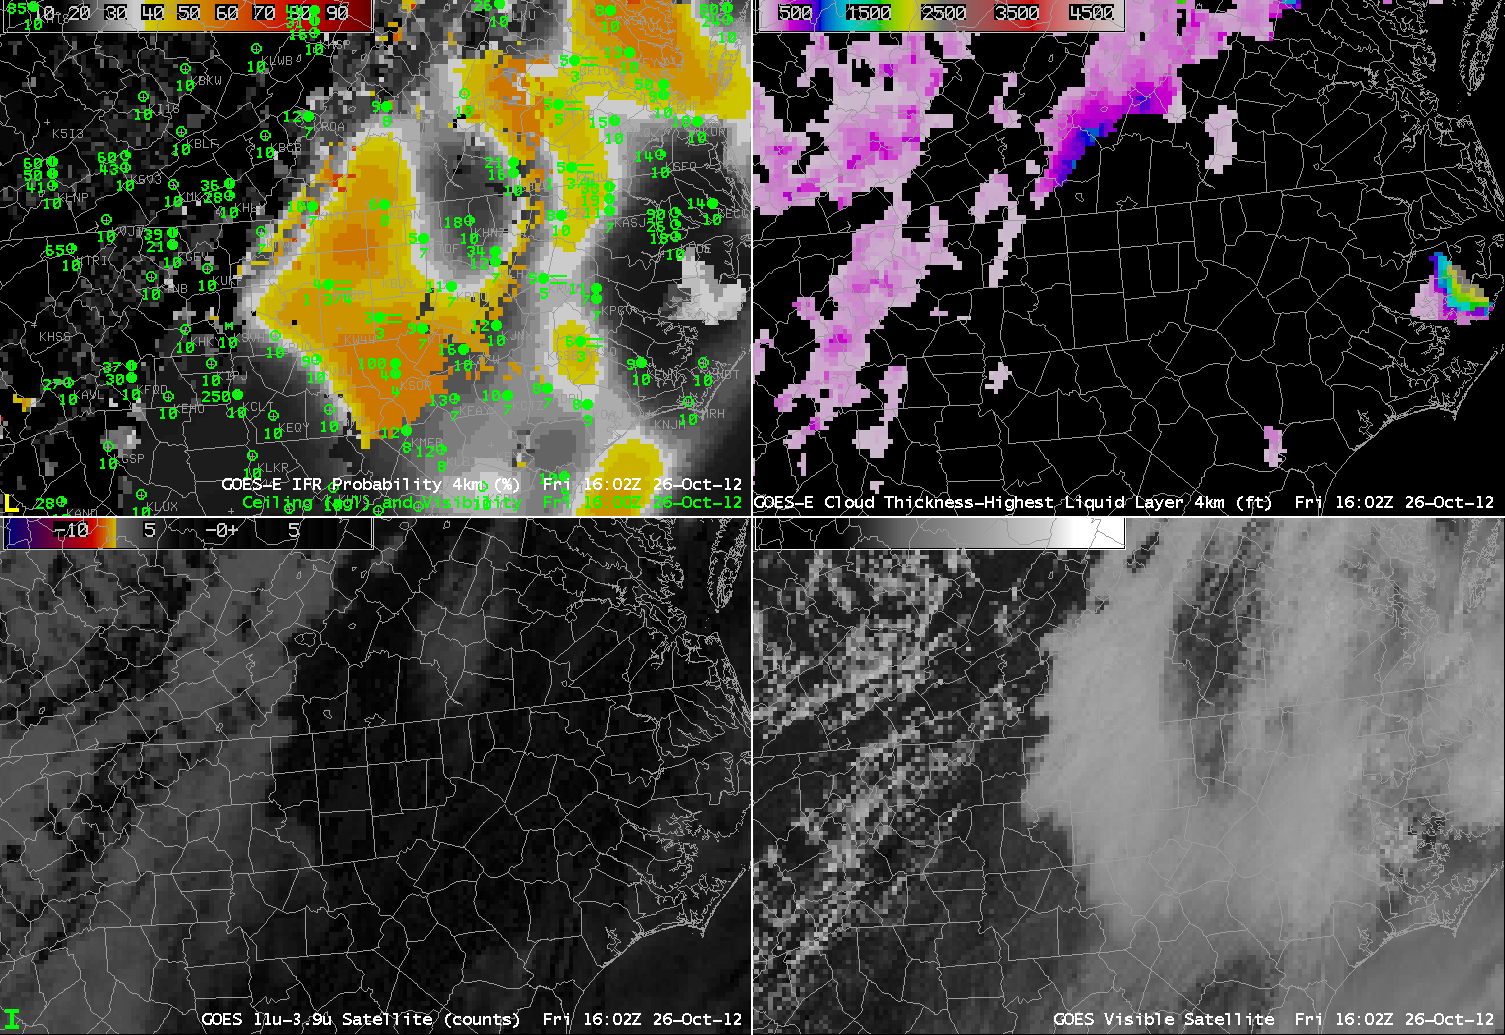
| GOES-R IFR Probability (Upper Left), GOES-R Cloud Thickness (Upper Right), GOES-East Brightness Temperature Difference (10.8 µm – 3.9 µm) Lower Left), GOES-East Visible Imagery (Lower Right) at 1600 UTC 26 October 2012 |
|
By 1600 UTC, the cirrus canopy from Sandy has overspread most of eastern North Carolina. This makes satellite data less useful in computing IFR probabilities, and Model Data comparatively more important, and the character of the IFR probability field does change, with a smoother field overall. At 1600 UTC the probabilities have decreased; the temporal evolution of the field (not shown) is still giving important information, especially in concert with the surface visibility/ceiling observations. The decrease in probabilities is gradual as the Sun slowly works to warm the boundary layer.