 |
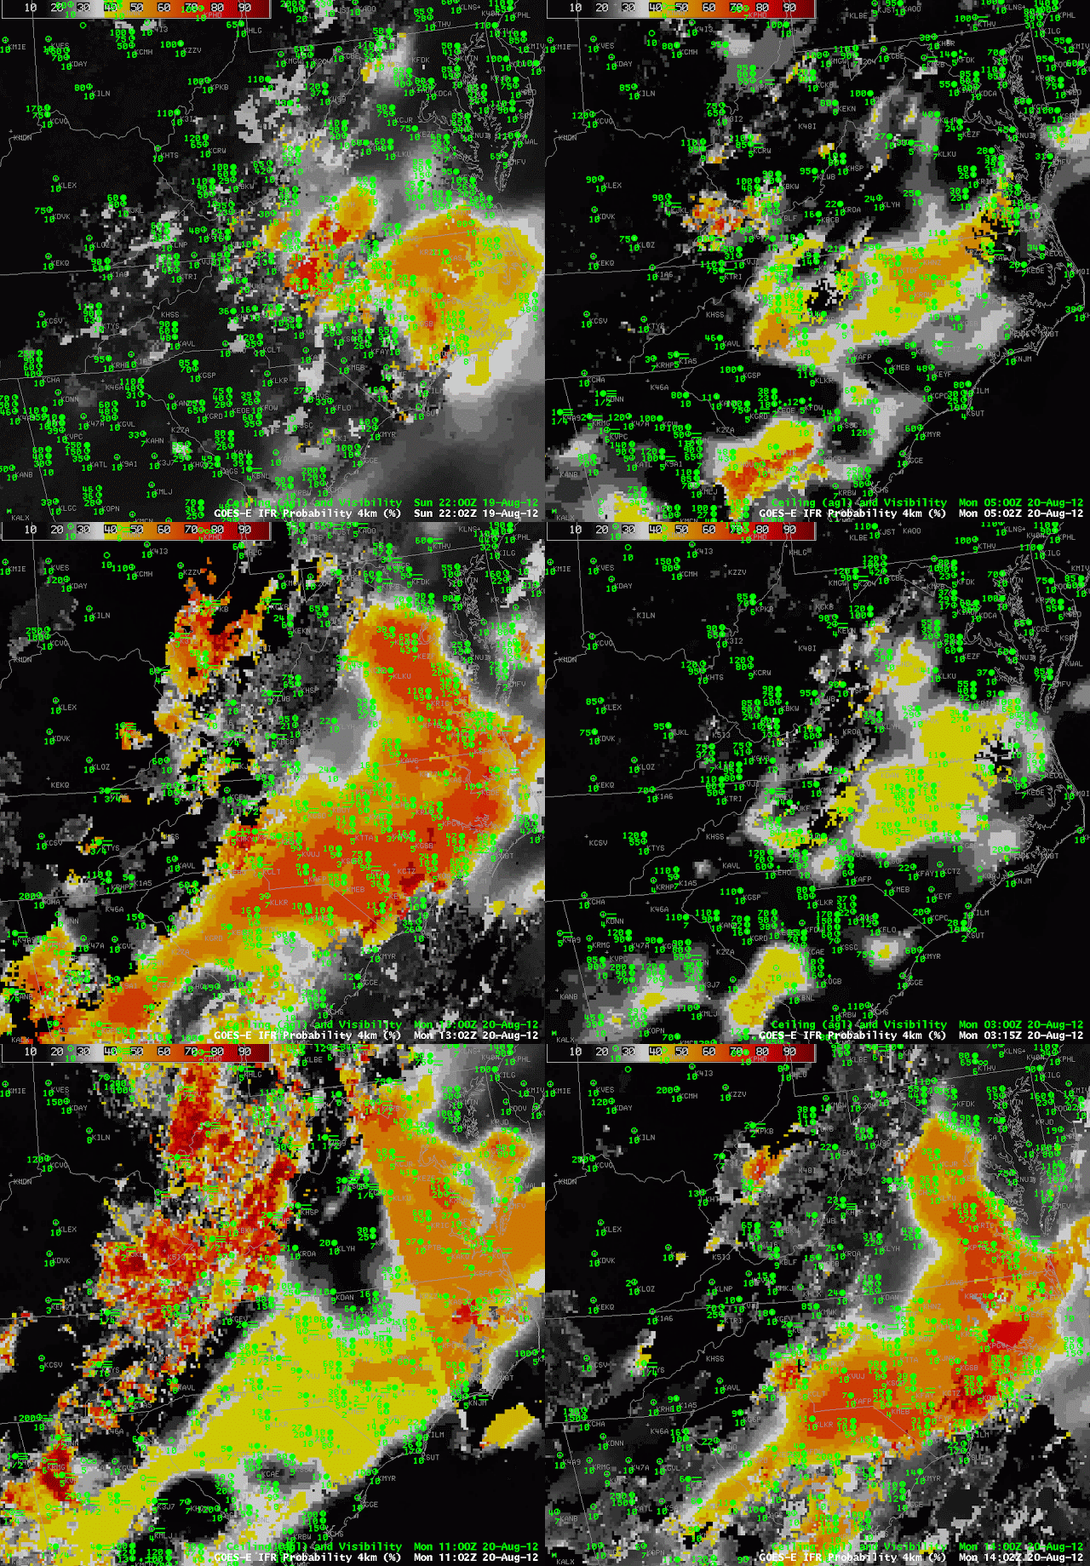
| GOES-R IFR Probabilities computed from GOES-East and from the Rapid Refresh, hourly from 2202 UTC on 19 August through 1402 UTC on 20 August |
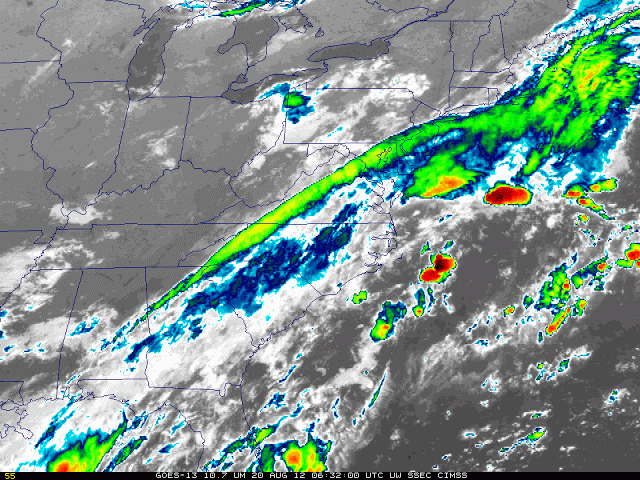
The animation above demonstrates the different ways in which GOES-R probabilities can be detected, and the values that can occur. Much of the East Coast was under a multi-layer cloud deck (as shown below in the color-enhanced 0632 GOES-East 10.7 µm image). In those places, IFR probabilities will be computed using Rapid Refresh model output, and the character of the IFR probability field will differ from how the field looks when satellite data are used as IFR predictors.
For example, the smooth IFR probability field over North Carolina in this loop (especially from 0300 UTC to 0700 UTC) strongly indicates model-only predictors. Before and after that time there are small regions that are more pixelated, suggesting satellite input. At 0600 UTC, GOES-R IFR probabilities start to increase over West Virginia as overnight cooling allows temperatures to approach the dewpoint, and fog starts to develop. Probabilities become quite high by sunrise over and near West Virginia, and IFR conditions are evident. IFR probabilities where satellite and model data are used as predictors — as over West Virginia — are generally higher than regions where model data only are used (over North Carolina). Model data will always be included in the computation of IFR probabilities. In regions of multiple cloud layers, such as over North Carolina, it is used alone and IFR probabilities can be high. In regions of low clouds, such as over West Virginia, the model underscores what the satellite data are telling and IFR probabilities will be even higher. There can also be regions where the Satellite and Model predictors give conflicting information on the presence of fog/low stratus. In these regions, IFR probabilities will be somewhat lower.
Note that the terminator is present in this loop, both at sunset (2345 UTC) and at sunrise (the 1100 UTC imagery). The change in IFR probabilities that occur is evident as predictors that are used during the day change to or from those used at night. At 1100 UTC, probabilities are increasing by about 18% over North Carolina.
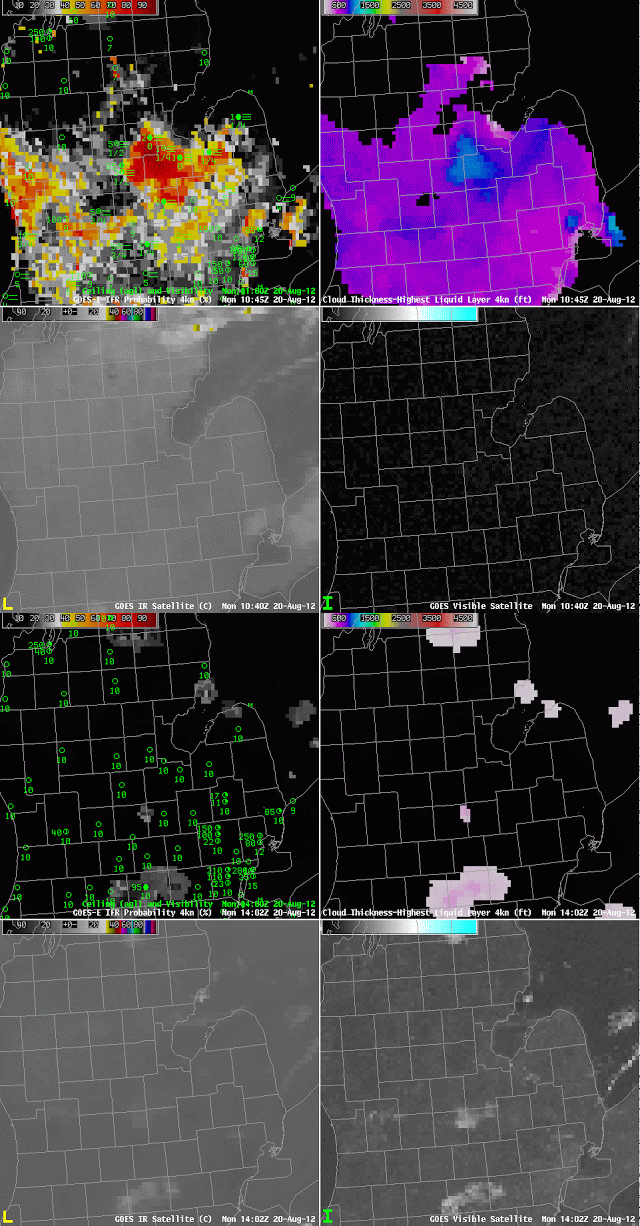
 |
| GOES-13 10.7 µm imagery at 0632 UTC on 20 August 2012. |


